


US Dollar and Gold Battle of the Cycles
Commodities / Gold and Silver 2017 Feb 21, 2017 - 11:09 AM GMTBy: SurfCity

 Nothing has changed from my last post on this pair. I mentioned we should expect some backtesting and that is what I am seeing on the charts. This should be expected, IMO as both are at a key inflection point in their longer Intermediate Cycles and the battle is on.
https://surfcity.co/2017/02/15/usd-and-gold-update/
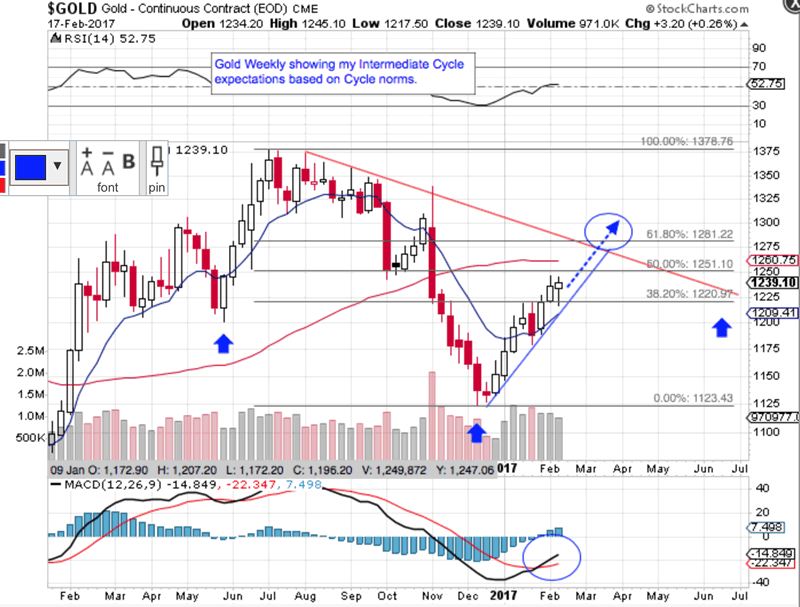
Many will want to know if the PM complex will make new highs above last Summer before we top in this Intermediate Cycle? While it is possible, my expectations are that we should test and breach the Red Yearly Cycle downtrend on my Gold Weekly chart in Trading Cycle #2 and then we need to see how Gold reacts after its TC2 Low as the USD may be moving out of its longer Intermediate Cycle Low around that time. The key to my last sentence was “may be,” so we will recalibrate our next steps at that time.
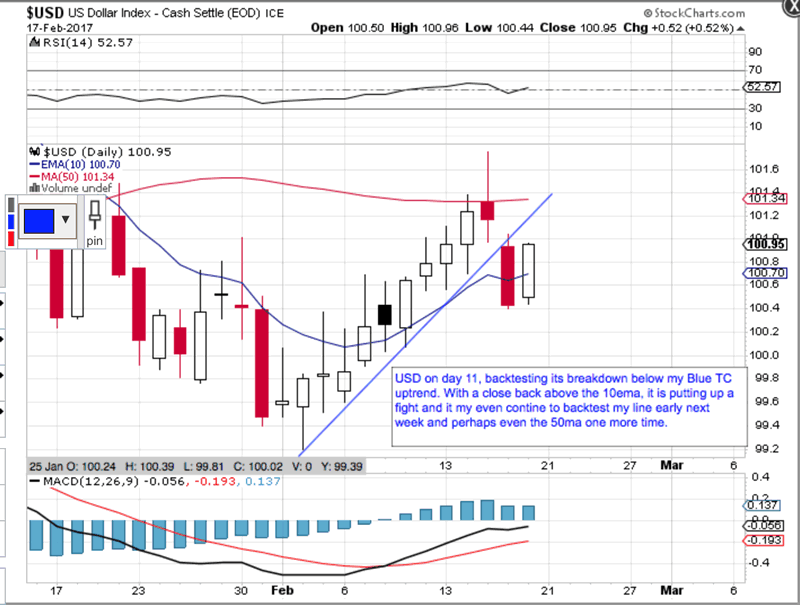
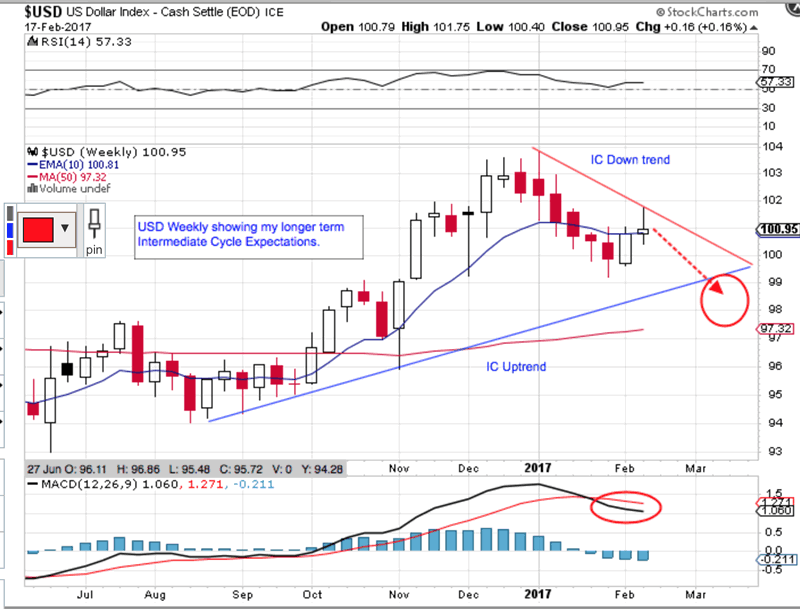
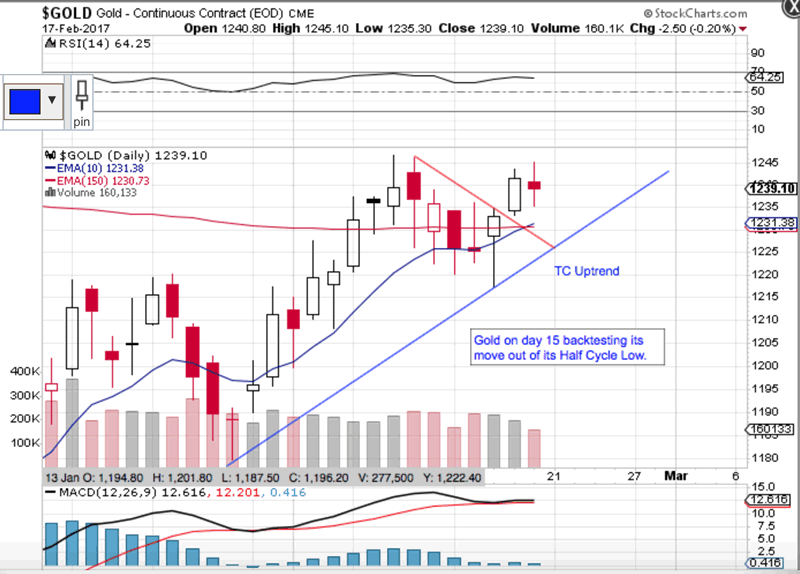
Below are two charts on the USD followed by two charts on Gold. Each pair of charts has a near term Daily and a longer term weekly to show you where they are in their respective Intermediate Cycles and the struggle that is under way in these two related markets.
USD Daily and Weekly:
Gold Daily and Weekly:
If you follow Fibonacci levels at all, we often see some kind of pullback in an uptrend near the 62% retrace level. My Gold weekly below shows you this possibility on the chart as a 50% retrace won’t break my Red Yearly Cycle downtrend. Also note, however, that TC1 topped out near the 38% Fib Retrace level from last year’s July High before moving into the TC1 Low. Lastly, the TC1 Low was a Fib 38% move lower from the rise out of the Yearly Cycle Low in December.
Who was that Fibonacci guy anyway and how did he know his arcane math would work on Financial charts before they even existed? He must have been some kind of super nerdy dude…
Surfer Dude hangs with Nerdy Fibonacci Dude. I love it! ��
By Surf City
Everything about Cycle Investing
© 2017 Surf City - All Rights Reserved
Disclaimer: The above is a matter of opinion provided for general information purposes only and is not intended as investment advice. Information and analysis above are derived from sources and utilising methods believed to be reliable, but we cannot accept responsibility for any losses you may incur as a result of this analysis. Individuals should consult with their personal financial advisors.
© 2005-2022 http://www.MarketOracle.co.uk - The Market Oracle is a FREE Daily Financial Markets Analysis & Forecasting online publication.