Most Popular
1. It’s a New Macro, the Gold Market Knows It, But Dead Men Walking Do Not (yet)- Gary_Tanashian
2.Stock Market Presidential Election Cycle Seasonal Trend Analysis - Nadeem_Walayat
3. Bitcoin S&P Pattern - Nadeem_Walayat
4.Nvidia Blow Off Top - Flying High like the Phoenix too Close to the Sun - Nadeem_Walayat
4.U.S. financial market’s “Weimar phase” impact to your fiat and digital assets - Raymond_Matison
5. How to Profit from the Global Warming ClImate Change Mega Death Trend - Part1 - Nadeem_Walayat
7.Bitcoin Gravy Train Trend Forecast 2024 - - Nadeem_Walayat
8.The Bond Trade and Interest Rates - Nadeem_Walayat
9.It’s Easy to Scream Stocks Bubble! - Stephen_McBride
10.Fed’s Next Intertest Rate Move might not align with popular consensus - Richard_Mills
Last 7 days
Global Warming ClImate Change Mega Death Trend - 8th Apr 24
Gold Is Rallying Again, But Silver Could Get REALLY Interesting - 8th Apr 24
Media Elite Belittle Inflation Struggles of Ordinary Americans - 8th Apr 24
Profit from the Roaring AI 2020's Tech Stocks Economic Boom - 8th Apr 24
Stock Market Election Year Five Nights at Freddy's - 7th Apr 24
It’s a New Macro, the Gold Market Knows It, But Dead Men Walking Do Not (yet)- 7th Apr 24
AI Revolution and NVDA: Why Tough Going May Be Ahead - 7th Apr 24
Hidden cost of US homeownership just saw its biggest spike in 5 years - 7th Apr 24
What Happens To Gold Price If The Fed Doesn’t Cut Rates? - 7th Apr 24
The Fed is becoming increasingly divided on interest rates - 7th Apr 24
The Evils of Paper Money Have no End - 7th Apr 24
Stock Market Presidential Election Cycle Seasonal Trend Analysis - 3rd Apr 24
Stock Market Presidential Election Cycle Seasonal Trend - 2nd Apr 24
Dow Stock Market Annual Percent Change Analysis 2024 - 2nd Apr 24
Bitcoin S&P Pattern - 31st Mar 24
S&P Stock Market Correlating Seasonal Swings - 31st Mar 24
S&P SEASONAL ANALYSIS - 31st Mar 24
Here's a Dirty Little Secret: Federal Reserve Monetary Policy Is Still Loose - 31st Mar 24
Tandem Chairman Paul Pester on Fintech, AI, and the Future of Banking in the UK - 31st Mar 24
Stock Market Volatility (VIX) - 25th Mar 24
Stock Market Investor Sentiment - 25th Mar 24
The Federal Reserve Didn't Do Anything But It Had Plenty to Say - 25th Mar 24

Market Oracle FREE Newsletter

How to Protect your Wealth by Investing in AI Tech Stocks

Stock Market Lindsay’s 107-day Interval

Stock-Markets / Stock Market 2017 Feb 20, 2017 - 10:30 PM GMT

By: Ed_Carlson

Stock-Markets

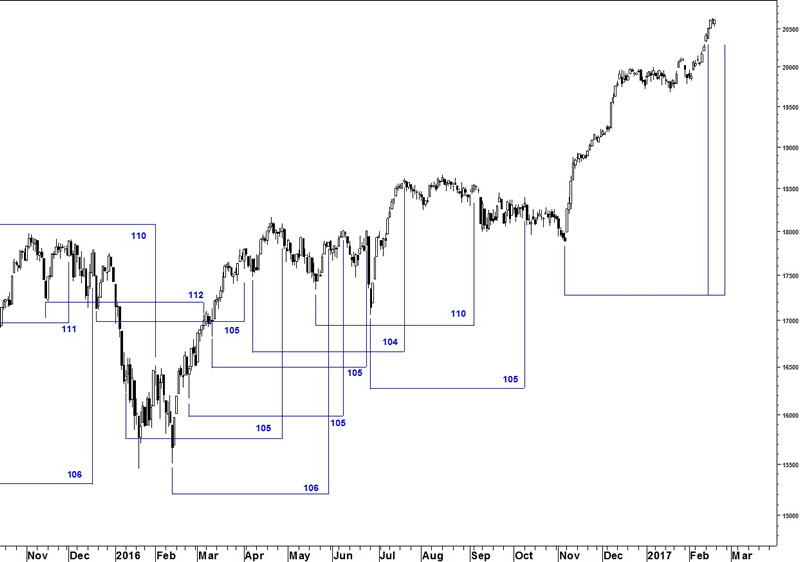
George Lindsay wrote of a 107-day interval which he used as a confirming tool for finding highs in the Dow. Like all of Lindsay’s models, this one was not to be used in isolation – a common mistake made by those familiar with his most popular model – Three Peaks and a Domed House.


The 107-interval is actually an interval stretching anywhere from 102 to 112 days. Lindsay had a plethora of different methods of identifying the lows from which to count the interval but as long as we count from a low of some significance – and the forecast matches other forecasts – it promises to be time well-spent.

Sometimes the model points, not to the highest high, but to the final high in a topping formation; similar to the highs last September and October.

The 11/4/16 is clearly a significant low. It forecasts a high in the period from February 14 (102 days) to February 25 (112 days) and is close enough to other Lindsay forecasts (published here previously) for a high in our current period.  

Try a "sneak-peek " this month at Seattle Technical Advisors.com

Ed Carlson, author of George Lindsay and the Art of Technical Analysis, and his new book, George Lindsay's An Aid to Timing is an independent trader, consultant, and Chartered Market Technician (CMT) based in Seattle. Carlson manages the website Seattle Technical Advisors.com, where he publishes daily and weekly commentary. He spent twenty years as a stockbroker and holds an M.B.A. from Wichita State University.

© 2017 Copyright Ed Carlson - All Rights Reserved

Disclaimer: The above is a matter of opinion provided for general information purposes only and is not intended as investment advice. Information and analysis above are derived from sources and utilising methods believed to be reliable, but we cannot accept responsibility for any losses you may incur as a result of this analysis. Individuals should consult with their personal financial advisors.


© 2005-2022 http://www.MarketOracle.co.uk - The Market Oracle is a FREE Daily Financial Markets Analysis & Forecasting online publication.


Post Comment

Only logged in users are allowed to post comments. Register/ Log in