


SPX Stocks Bull Market Continues
Stock-Markets / Stock Market 2017 Feb 04, 2017 - 02:07 PM GMTBy: Tony_Caldaro

 The week started at SPX 2295. After a gap down opening Monday the market traded down to SPX 2267 on Tuesday. Then Wednesday’s opening was a gap up, followed by a pullback, then another gap up opening on Friday ending the week at SPX 2297. For the week the SPX/DOW were mixed, and the NDX/NAZ were mixed as well. Economic reports for the week were again mostly positive. On the downtick: the Chicago PMI, consumer confidence, construction spending, auto sales, ISM services, the WLEI, plus the unemployment rate rose. On the uptick: personal income/spending, the PCE, pending home sales, Case-Shiller, the ADP, the ISM, NF Payrolls, factory orders, the Q1 GDP estimate, plus weekly jobless claims were lower. Next week’s reports will be highlighted by the trade balance, the budget deficit and export/import prices. Best to your week!
LONG TERM: uptrend
The Primary wave III bull market continues to unfold, but has spent the most part of the last two months trading above and below the OEW 2270 and 2286 pivots. For the year, which is about 5 weeks old, the SPX is up 2.6%. The wave pattern/labeling we have been tracking remains unchanged.
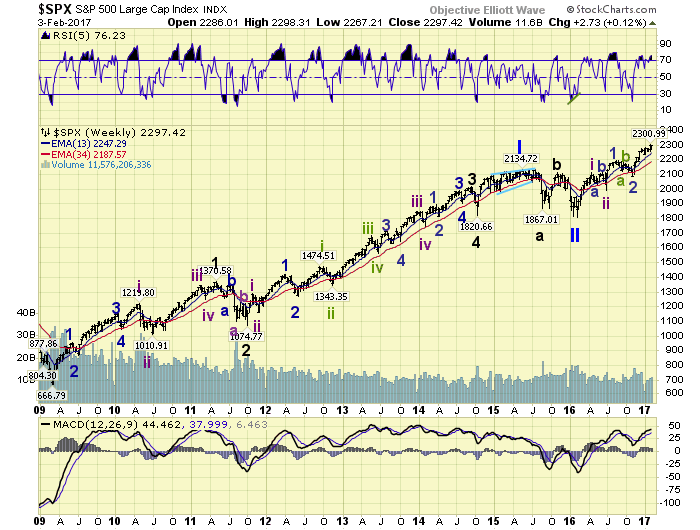
Since we are expecting a relatively long Major wave 1 of Primary III, we started the first waves with an Intermediate labeling i and ii. The second set of waves is a subdivision of Intermediate wave iii: Minor waves 1 and 2. From the Minor 2 low in early November, just before the election, we have been expecting a Minor wave 3 to unfold. Thus far it still looks too short to be all of Minor 3, as it is barely longer than the previous Minor 1 uptrend (216 pts. v 202 pts.). In the meantime while the market sorts itself out there are a couple of more important points that should be noted.
Should the market enter a correction soon we are likely to see only a 5% decline. Should the market clear SPX 2336, the last potential B wave count, then we can expect 1 – 3 years of bull market activity with the SPX reaching 3000+. Should the market drop below SPX 2084, then the B wave has topped and we are likely in a C wave bear market.
MEDIUM TERM: uptrend
The current uptrend began in early November at SPX 2084. The uptrend has risen for 2 months, which has been the characteristic of the previous impulse uptrends for this bull market. Any new high in the month of February would immediately suggest this uptrend is extending in time and price.
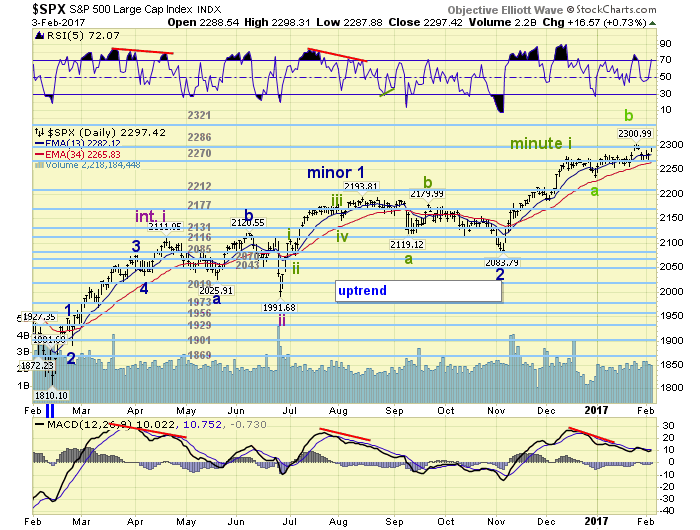
After tracking several potential variations of the short term waves of this uptrend, we settled on two potential counts. The count posted on the chart above suggests only Minute i of Minor 3 completed at SPX 2279, and since then the market has been in an irregular Minute ii correction. This count would require a decline to at least SPX 2234, possibly lower, before ending the correction.
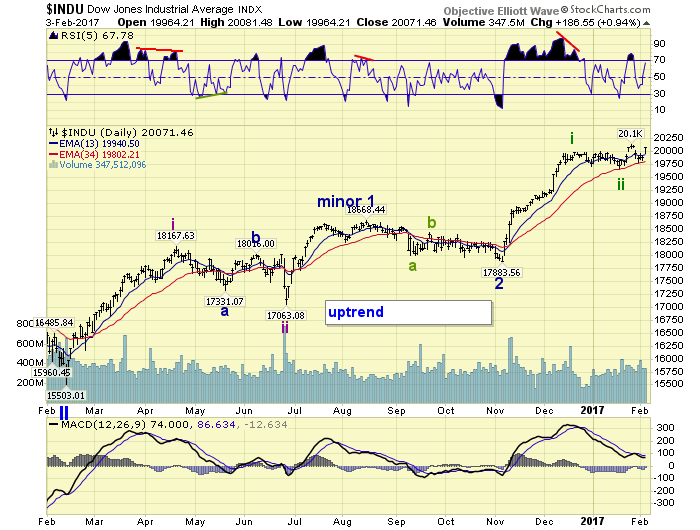
The second count is posted on the DOW charts as noted above. This count suggests Minute i ended at around the same area as the SPX, but Minute ii ended in mid-January. And, the market is currently working its way higher in a Minute iii rally. Thus far it has not been acting like a third wave, and will need to clear SPX 2305 to look more positive. Medium term support is at the 2286 and 2270 pivots, with resistance at the 2321 and 2336 pivots.
SHORT TERM
The five waves up from the SPX 2084 early-November low on both the SPX and DOW counts looks quite clear. The question that is intriguing most is what has transpired since then. Is the market preparing to break out or break down?
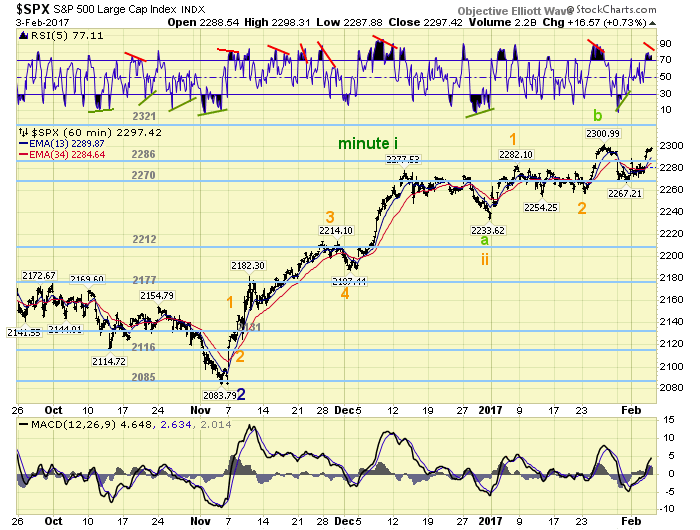
The irregular B count in green suggests the rally has probably topped, or soon will top below SPX 2305, before declining in a small c wave to SPX 2234 or lower. The count posted in orange, which looks more like the count posted on the DOW charts, suggests Minute iii is currently underway and has already completed two smaller Micro waves 1 and 2. The five wave advance for Minute i from SPX 2084-2279 was also five Micro waves. SPX 2305 and SPX 2267 are the key levels for both counts. A drop below SPX 2267 and a correction is likely underway. A breakout above SPX 2305 and the uptrend is extending.
Short term support is at the 2286 and 2270 pivots, with resistance at SPX 2301 and the 2321 pivot. Short term momentum ended the week overbought with a slight negative divergence. However, the market needs to decline at least 5 points to put the divergence in play. Best to your trading!
FOREIGN MARKETS
Asian markets were mostly lower on the week for a net loss of 0.8%.
European markets were also mostly lower and lost 0.6%.
The DJ World index gained 0.2%, and the NYSE gained 0.2% as well.
COMMODITIES
Bonds are in an uptrend and gained 0.1% on the week.
Crude appears to be in an uptrend and gained 1.2% on the week.
Gold is in an uptrend as well and gained 2.7% on the week.
The USD is in a downtrend and lost 0.8% on the week.
NEXT WEEK
Tuesday: trade deficit and consumer credit. Thursday: weekly jobless claims and wholesale inventories. Friday: export/import prices, consumer sentiment and the budget deficit. Saturday: a speech from vice chair Fischer in the UK.
CHARTS: http://stockcharts.com/public/1269446/tenpp
After about 40 years of investing in the markets one learns that the markets are constantly changing, not only in price, but in what drives the markets. In the 1960s, the Nifty Fifty were the leaders of the stock market. In the 1970s, stock selection using Technical Analysis was important, as the market stayed with a trading range for the entire decade. In the 1980s, the market finally broke out of it doldrums, as the DOW broke through 1100 in 1982, and launched the greatest bull market on record.
Sharing is an important aspect of a life. Over 100 people have joined our group, from all walks of life, covering twenty three countries across the globe. It's been the most fun I have ever had in the market. Sharing uncommon knowledge, with investors. In hope of aiding them in finding their financial independence.
Copyright © 2017 Tony Caldaro - All Rights Reserved Disclaimer: The above is a matter of opinion provided for general information purposes only and is not intended as investment advice. Information and analysis above are derived from sources and utilising methods believed to be reliable, but we cannot accept responsibility for any losses you may incur as a result of this analysis. Individuals should consult with their personal financial advisors.
Tony Caldaro Archive |
© 2005-2022 http://www.MarketOracle.co.uk - The Market Oracle is a FREE Daily Financial Markets Analysis & Forecasting online publication.