


Stock Market Trading Patience Pays Off with CHK Using Momentum Reversals
Stock-Markets / Stock Index Trading Jan 19, 2017 - 05:42 AM GMTBy: Chris_Vermeulen

 One of the key tenants of my Momentum Reversal trading is “waiting for the right trigger/event and getting in early”. I find this is one of the most difficult aspects for most clients to understand and master. Therefore, in an attempt to further illustrate some components of my thinking and strategy, I have put together these examples to try to help people understand these techniques.
Within this example, I’ve selected Chesapeake Energy Corp and a recent price move that resulted in strong gains. As you are well aware, within the Momentum Reversal Method (MRM) are a number of key factors that drive my investment methodology.
Additionally, I use Fibonacci and Elliot Wave Theory in all of my analysis and decision making. The Momentum Reversal Method is not foolproof – it does take some losing trades. Generally, though, the winners far outpace the losers. My trading strategy helps to answer these important questions.

Now, onto the setup I promised earlier – Chesapeake Energy Corp.
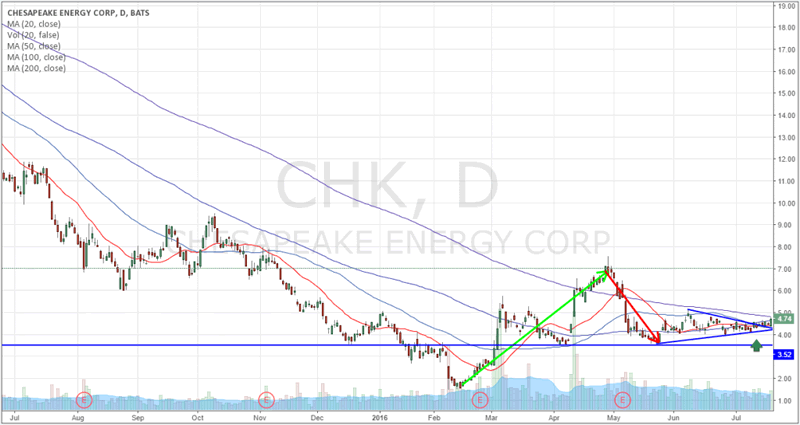
This chart illustrates three key components to my Momentum Reversal Method trading strategy:
– Established Price Momentum/Trend
– Defined Price Rotation
– Tightening/Coiling of price prior to a breakout
As you can see from the example chart, above, the upward price trend (highlighted in green) followed by the price rotation (highlighted in red) created a primary setup that allowed me to target this stock for potential trigger setups. In other words, this price momentum and rotation created an opportunity for trade signals.
The coiling of price with the flag/pennant formation created another component I often look for – price congestion. Price congestion following a wide range price rotation is usually indicative of a “pre-breakout move”. Therefore, the identification of this type of price action can sometimes be an early warning to watch it more closely for the trade trigger.
I’ve marked the initial breakout bar (not my ideal trade trigger) with a green up arrow. For the average trader, this would likely be your trading trigger. Within the Momentum Reversal Method, we look for early triggers that can allow us to get into these types of trades earlier – and often with much less risk and greater chance of success.
I hope this clear example of a MRM setup can assist you in understanding why this strategy is such a success.
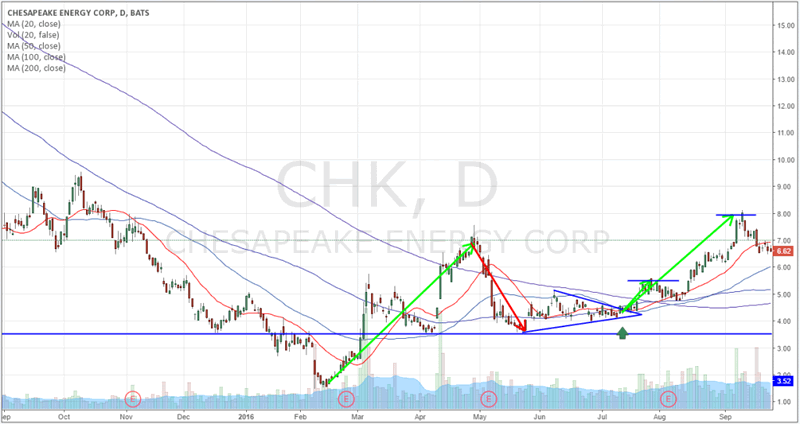
The Outcome
This, the outcome of the Setup, shows exactly how quickly these setups can turn into profits. Generally, the Momentum Reversal Method holds trades for 3~7 days for short-term trades and for 14~35 days for longer term trades (in some cases even a bit longer).
You may be wondering why we only hold trades for 3-7 days? The answer is simple, we know that most of the biggest moves happen in a very short period of time. The explosive pops/drops in price only last 3-7 days in most cases. Catching these quick explosive moves provide us with the best risk reward. As you know time is money, and it only makes sense to make as much as possible in the shortest period of time, which has two key benefits:
First is that I provide lower risk. The less time our money is locked into a trade/the markets the better as cash is king!
Second, it means we can rotate some of some/or all of our money into the next stock/leveraged ETF ready for its explosive pop/drop.
You can see from this image the first upward move from the trigger bar resulted in a +27.8% gain in only 10 trading days. The second phase run-up in price resulted in an +83.75% gain in an additional 29 days. Clean, Clear and Consistent.
Again, I’m not giving away my successful strategy to anyone. The Momentum Reversal Method has worked for me for years and continues to generate fantastic results. Even if I tried to teach you every aspect of this trading methodology/strategy, you would still need my assistance in understanding the nuances of how to deploy it and how to better understand general market sector rotation, when to avoid false triggers and what you should and should not trade and when.
This article is to help illustrate why the Momentum Reversal Method is a success and to teach you some of the basic concepts of Momentum Reversal triggers. My followers receive detailed analysis, research and trading triggers from my member based trading room. I can provide a source of valuable and timely trading triggers and follow-up research regarding all activity I announce to my clients. A few of our recent trades have been VUZI 16%, UGAZ 74%, and last week NUGT 50% on a portion and we are up over 75% on the balance which could be 100% by the end of week. The NUGT trade was partially based of a Market Trend Forecast we published back in December.
Feel free to visit www.ActiveTradingPartners.com to see how easy it is to profit from my analysis and to see how well the Momentum Reversal Method works in real-time.
I sincerely hope you enjoyed this article and were able to see how you can improve your future trading successes by using some of these components.
John Winston
Chief Investment Stratgist
Chris Vermeulen
Chris Vermeulen is Founder of the popular trading site TheGoldAndOilGuy.com. There he shares his highly successful, low-risk trading method. For 7 years Chris has been a leader in teaching others to skillfully trade in gold, oil, and silver in both bull and bear markets. Subscribers to his service depend on Chris' uniquely consistent investment opportunities that carry exceptionally low risk and high return.
Disclaimer: Nothing in this report should be construed as a solicitation to buy or sell any securities mentioned. Technical Traders Ltd., its owners and the author of this report are not registered broker-dealers or financial advisors. Before investing in any securities, you should consult with your financial advisor and a registered broker-dealer. Never make an investment based solely on what you read in an online or printed report, including this report, especially if the investment involves a small, thinly-traded company that isn’t well known. Technical Traders Ltd. and the author of this report has been paid by Cardiff Energy Corp. In addition, the author owns shares of Cardiff Energy Corp. and would also benefit from volume and price appreciation of its stock. The information provided here within should not be construed as a financial analysis but rather as an advertisement. The author’s views and opinions regarding the companies featured in reports are his own views and are based on information that he has researched independently and has received, which the author assumes to be reliable. Technical Traders Ltd. and the author of this report do not guarantee the accuracy, completeness, or usefulness of any content of this report, nor its fitness for any particular purpose. Lastly, the author does not guarantee that any of the companies mentioned in the reports will perform as expected, and any comparisons made to other companies may not be valid or come into effect.
Chris Vermeulen Archive |
© 2005-2022 http://www.MarketOracle.co.uk - The Market Oracle is a FREE Daily Financial Markets Analysis & Forecasting online publication.