Stock Market Inauguration Day Selling?
Stock-Markets / Stock Market 2017 Jan 17, 2017 - 04:15 AM GMTBy: Brad_Gudgeon
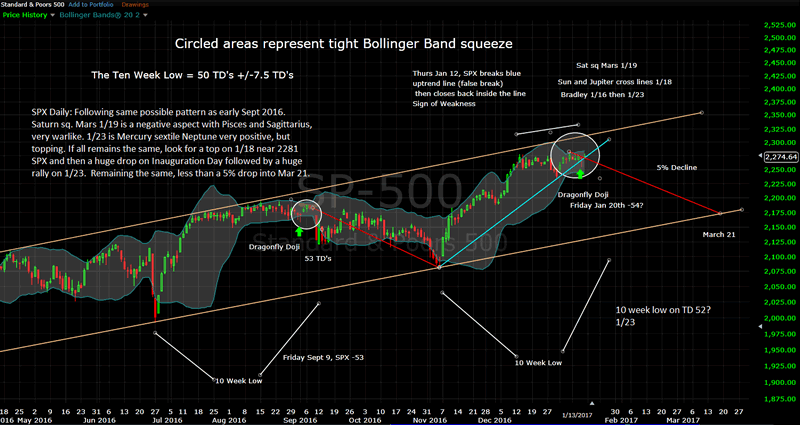
Last time I wrote, I discussed the possibility of a Friday the 13th sell-off. Did I really believe it would happen? Actually, the odds were better for a January 20th sell-off based on the planets and dragonfly candle stick pattern we saw on 1/12 than the 13th.
What I was pointing out was the 10 week cycle low pattern ( 6 or 7 TD's from 50 TD's) and daily Bollinger Band squeeze alone. Now we have Mars Sq. Saturn 1/19 and the Sun/Jupiter lines crossing on 1/18. On 1/23 we have Mercury sextiling Neptune. That day should be very positive!
The parallels between Sept 9 and Jan 20 are striking! Looks like a less than 5% drop into March 21! Watch for a summer top!
S&P500 Inauguration Day Crash Chart

Brad Gudgeon
Editor of The BluStar Market Timer
The BluStar Market Timer was rated #1 in the world by Timer Trac in 2014, competing with over 1600 market timers. This occurred despite what the author considered a very difficult year for him. Brad Gudgeon, editor and author of the BluStar Market Timer, is a market veteran of over 30 years. The website is www.blustarmarkettimer.info To view the details more clearly, you may visit our free chart look at www.blustarcharts.weebly.com.
Copyright 2016, BluStar Market Timer. All rights reserved.
Disclaimer: The above information is not intended as investment advice. Market timers can and do make mistakes. The above analysis is believed to be reliable, but we cannot be responsible for losses should they occur as a result of using this information. This article is intended for educational purposes only. Past performance is never a guarantee of future performance.
Brad Gudgeon Archive |
© 2005-2022 http://www.MarketOracle.co.uk - The Market Oracle is a FREE Daily Financial Markets Analysis & Forecasting online publication.


