Stock Market Patterns & Cycles Pointing to SPX 2300 by Month End
Stock-Markets / Stock Market 2017 Jan 14, 2017 - 04:46 PM GMTBy: Jack_Steiman
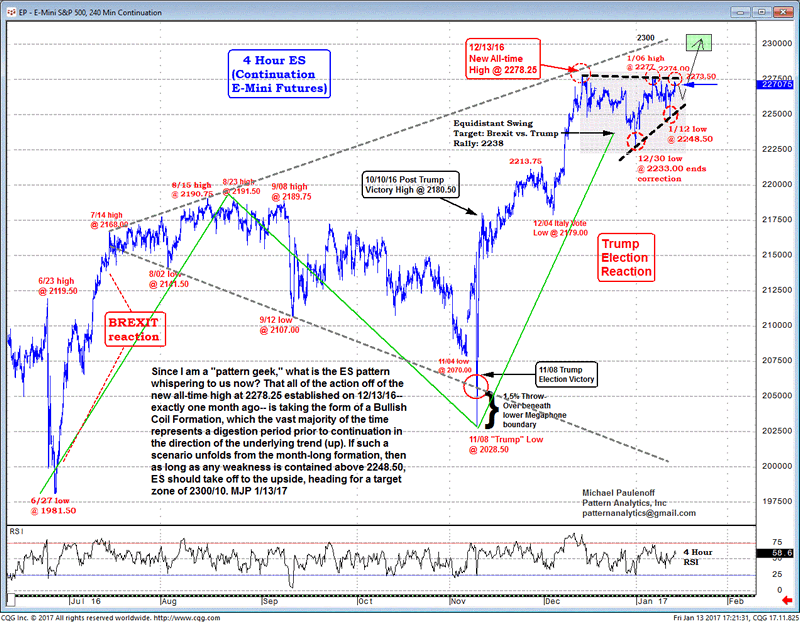
Since I am a "pattern geek," what is the Emini S&P 500 pattern whispering to us now? That all of the action off of the new all-time high at 2278.25 established on December 13 -- exactly one month ago -- is taking the form of a Bullish Coil Formation, which the vast majority of the time represents a digestion period prior to continuation in the direction of the underlying trend (up).
If such a scenario unfolds from the month-long formation, then as long as any weakness is contained above 2248.50, ES should take off to the upside, heading for a target zone of 2300/10.

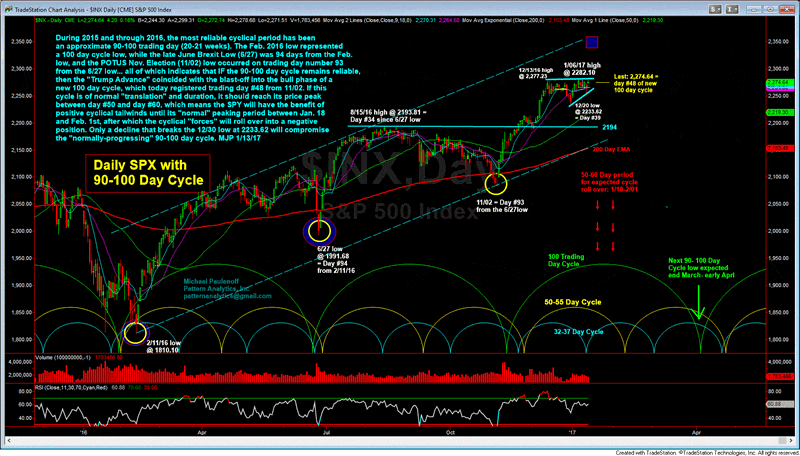
I am also a cycle geek. During 2015 and through 2016, the most reliable cyclical period has been an approximate 90-100 trading day (20-21 weeks). The February 2016 low represented a 100-day cycle low, while the late June Brexit Low (June 27) was 94 days from the February low, and the POTUS November Election (Nov 2) low occurred on trading day number 93 from the Jun 27 low. All of this indicates that IF the 90-100 day cycle remains reliable, then the "Trump Advance" coincided with the blast-off into the bull phase of a new 100-day cycle, which on Friday registered trading day #48 from Nov 2.
If this cycle is of normal "translation" and duration, it should reach its price peak between day #50 and day #60, which means the SPY will have the benefit of positive cyclical tailwinds until its "normal" peaking period between January 18 and February 1. After that time, the the cyclical "forces" will roll over into a negative position.

Only a decline that breaks the Dec 30 low at 2233.62 will compromise the "normally-progressing" 90-100 day cycle.
Have a great trading week!
Mike
Jack Steiman has moved on from SwingTradeOnline, but we hope you enjoy our new STO analyst, Mike Paulenoff, a veteran Wall Street technical strategist. More about Mike ...
Jack Steiman is author of SwingTradeOnline.com ( www.swingtradeonline.com ). Former columnist for TheStreet.com, Jack is renowned for calling major shifts in the market, including the market bottom in mid-2002 and the market top in October 2007.
Sign up for a Free 15-Day Trial to SwingTradeOnline.com!
© 2016 SwingTradeOnline.com
Mr. Steiman's commentaries and index analysis represent his own opinions and should not be relied upon for purposes of effecting securities transactions or other investing strategies, nor should they be construed as an offer or solicitation of an offer to sell or buy any security. You should not interpret Mr. Steiman's opinions as constituting investment advice. Trades mentioned on the site are hypothetical, not actual, positions.
© 2005-2022 http://www.MarketOracle.co.uk - The Market Oracle is a FREE Daily Financial Markets Analysis & Forecasting online publication.


