Test Your Markets Trading Knowledge: Find the Clear Wave Pattern on this Chart
InvestorEducation / Elliott Wave Theory Jan 09, 2017 - 05:11 PM GMTBy: EWI
 Take this quiz, then check your answer against one of our top analysts
Do you see a pattern you recognize in this chart of Reynolds American (RAI)?
The Wave Principle separates price action into two categories: motive and corrective, and this price chart has a clear example of one category.
Take a close look, remembering that five-wave moves are motive while three-wave moves are corrective. Then see if you can answer these questions:
- Do you see a motive or a corrective move?
- What's the name of the pattern? (If motive: impulse wave or ending diagonal; if corrective: zigzag, flat or triangle)
- Do you see wave patterns within the larger waves of the pattern?
Here's some help from Senior Analyst Jeffrey Kennedy:
"A defining characteristic of this pattern is that it tends to be contained within parallel lines. It is the most prevalent corrective wave pattern."
That's a bit of a giveaway. Now label the waves on the chart between the words Top and Bottom.

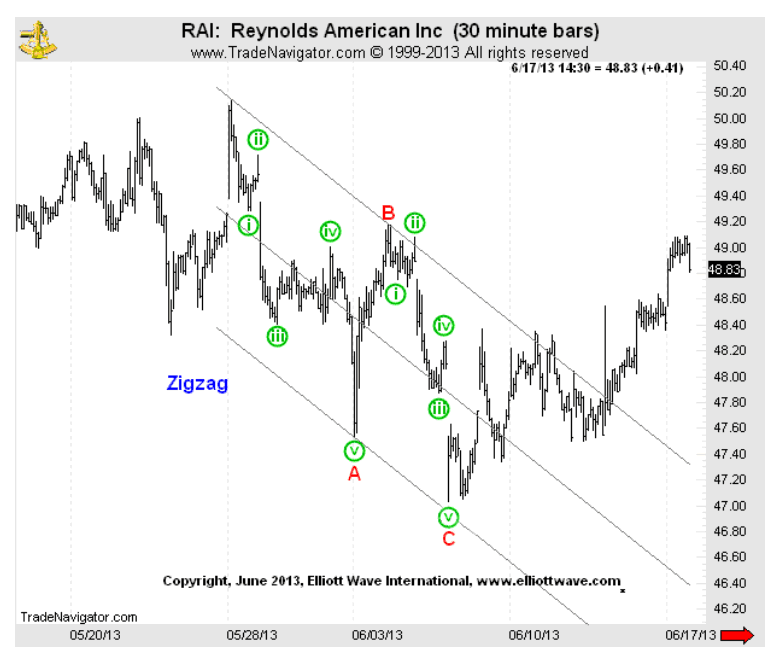
Now, here's Jeffrey's labeled chart:

Notice that the Wave Principle uses A-B-C to label corrective waves and numerals 1 through 5 (or in this case, i through v) for motive waves.
Jeffrey explains that zigzags, which consist of three waves, are more prevalent than flats or triangles. Their substructure is 5-3-5 because wave A subdivides into five waves, wave B is a three-wave structure, and wave C also contains five waves.
Test Your Wave Counting SkillsIt doesn't matter if you're a novice or experienced Elliottician, the more you practice the better you'll become at identifying waves. Take the challenge and test your wave counting skills on the charts in this free resource. |
This article was syndicated by Elliott Wave International and was originally published under the headline Test Your Knowledge: Find the Clear Wave Pattern on this Chart. EWI is the world's largest market forecasting firm. Its staff of full-time analysts led by Chartered Market Technician Robert Prechter provides 24-hour-a-day market analysis to institutional and private investors around the world.
About the Publisher, Elliott Wave International
Founded in 1979 by Robert R. Prechter Jr., Elliott Wave International (EWI) is the world's largest market forecasting firm. Its staff of full-time analysts provides 24-hour-a-day market analysis to institutional and private investors around the world.
© 2005-2022 http://www.MarketOracle.co.uk - The Market Oracle is a FREE Daily Financial Markets Analysis & Forecasting online publication.


