


The Gold Market in 2016
Commodities / Gold and Silver 2016 Jan 06, 2017 - 04:37 PM GMTBy: Arkadiusz_Sieron

 How can we summarize the last year in the gold market? First of all, it was a mixed year for gold. The first half of 2016 was excellent for the yellow metal. Actually, the several-month long bull market in gold started in December 2015, when the shiny metal found a bottom at $1,049, after the FOMC historical meeting and the first interest rate hike for almost a decade. From then, the shiny metal made higher highs and higher lows, reaching a peak at $1,366 at the early July in the aftermath of the British referendum on the withdrawal from the EU. Gold was one of the best performing assets that time, and gained about 30 percent, as one can see in the chart below.
Chart 1: The price of gold in U.S. dollars in 2016 (London P.M. Fix).
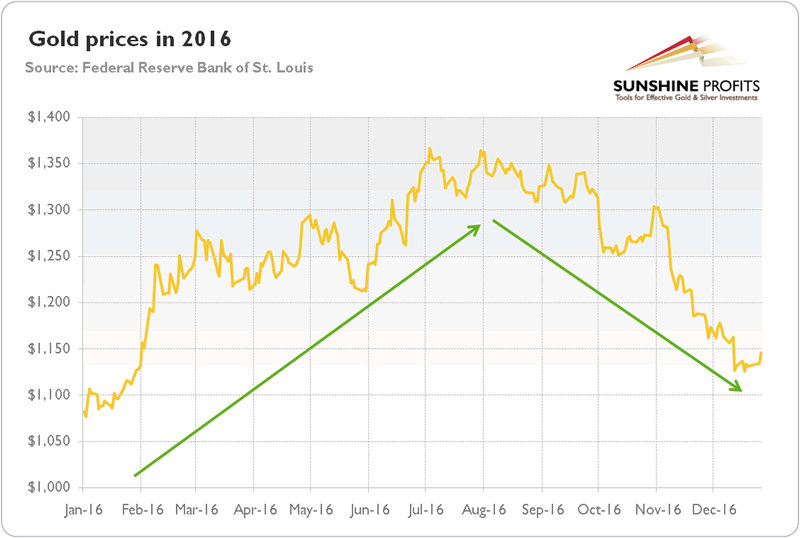
With the gloomy outlook after the Brexit vote and the uncertainty about the outcome of the U.S. presidential election, the future of gold was supposed to be rosy. However, nothing could be further from the truth. Since then, the shiny metal has been making lower highs and lower lows, with the one short-lived rally on election night. In December 2016, the price of gold dropped below $1,150, not a very distant level from the beginning of the year. Anyway, the yellow metal managed to gain about 8 percent in 2016. It is definitely an important improvement compared to previous bearish years (by the way, in the previous annual summary and outlook, we correctly predicted that 2016 will be better for gold than 2015), but gold’s performance fell short of expectations based on the fundamental data. What is especially striking is that gold prices did not rally despite many potential catalysts, such as the Brexit vote, the Trump victory, the terrorists attacks in Europe, the geopolitical tensions in the Middle East, or the defeat of Italy's constitutional referendum.
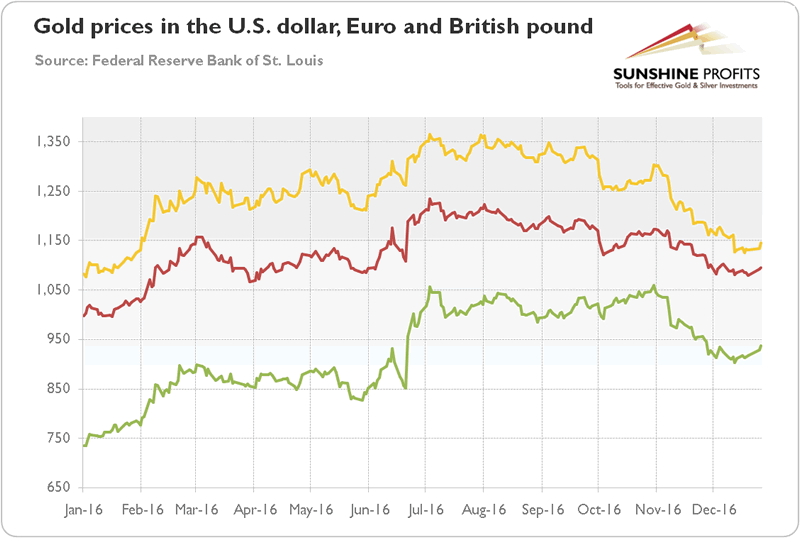
Interestingly, the price of gold expressed in Euros and British pounds showed a similar development to the U.S. dollar-denominated price, as one can see in the chart below. However, on a relative basis, the price of gold gained much more in these two currencies (especially in British pounds, which shows that gold prices actually responded to the Brexit vote), confirming the impact of the greenback’s value on the price of gold.
Chart 2: The price of gold in the U.S. dollar (yellow line), the Euro (red line) and the British pound (green line) in 2016 (London P.M. Fix).
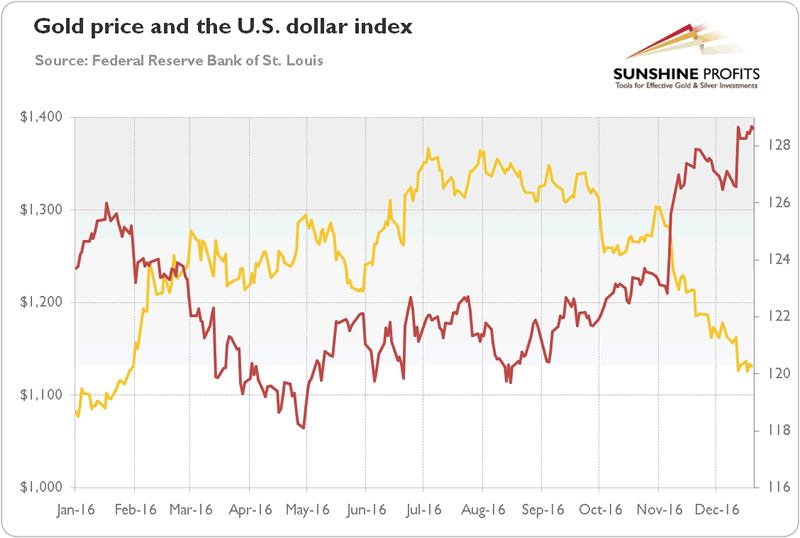
Indeed, the U.S. dollar was one of the main drivers of the gold prices in the last year, as the next chart shows. Actually, the price of gold looks like a mirror reflection of the greenback’s value. Gold prices rallied in the first quarter of 2016, while the U.S. dollar declined due to stock market turmoil and concerns about the global economy. Then, this trend reversed in May, when the surprisingly hawkish minutes of the Fed’s April meeting were released. However, the decline in gold prices did not last long, as the shockingly weak May payrolls and the following dovish Yellen’s comments weakened the greenback and increased the safe-haven demand for gold. In the third quarter of 2016, the U.S. dollar was trading sideways and gold ran out of steam. But since September, the Fed started telegraphing high chances of a rate hike in December, which sent gold prices south in October. And the post-election rally in the greenback sent a killing blow to the yellow metal.
Chart 3: The price of gold (yellow line, left axis, P.M. London Fix) and the U.S. dollar index (red line, right axis, Trade Weighted Broad U.S. Dollar Index) in 2016.
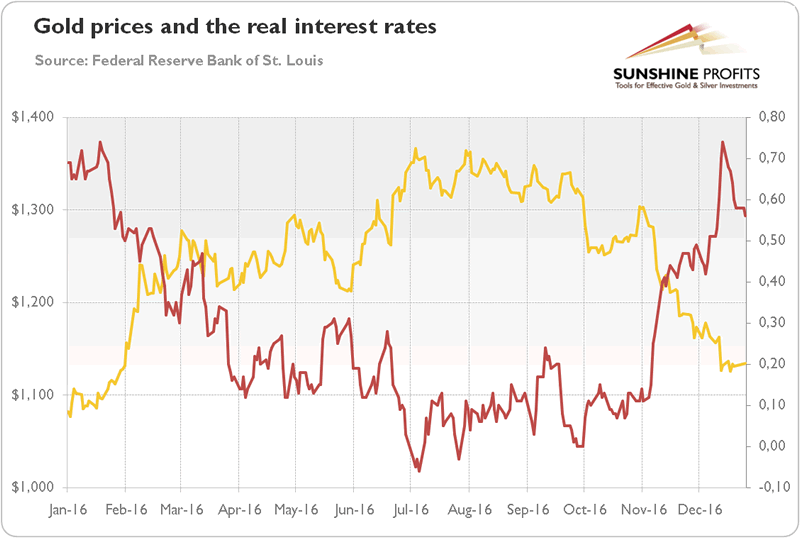
As usual, the real interest rates also played a significant role in driving the price of gold. Actually, the negative correlation is even stronger here than in the case of the yellow metal and greenback (as both these assets were rising after the Brexit vote). The mirror-image symmetry between the price of gold and real interest rates confirms that the shiny metal is a monetary asset strongly affected by the Fed’s actions and U.S. macroeconomic situation in the medium and long run. It was perhaps the best seen in the aftermath of the Trump’s victory, when real interest rates rose due to expectations of fiscal stimulus and accelerated real economic growth.
Chart 4: The price of gold (yellow line, left axis, London P.M. Fix) and the U.S. real interest rates (red line, right axis, yields on 10-year Treasury Inflation-Indexed Security) in 2016.
To sum up, the price of gold rose by 8 percent in 2016. Although it performed better than last year, all gains were made in the first half of the year. Indeed, gold was one of the best investments in the H1 2016, and one of the worst in the second half of the year. The stronger U.S. dollar and rising real interest rates caused gold prices to fall like a stone in the fourth quarter of the year. It means that the bull market of 2016 has turned bearish, as market sentiment and macroeconomic conditions changed in the aftermath of the U.S. presidential election. Hence, gold investors should focus on the above-mentioned factors, not on the geopolitics, gold reserves and annual balance between demand and supply. Will the bear market continue in 2017? It depends on the U.S. central bank actions and market sentiment toward Trump’s policies. If investors believe in stronger real economic growth and a more hawkish Fed, the greenback may strengthen, while the price of gold will decline further. On the other hand, if investors believe that Trump’s will not accelerate growth but only inflation, while the Fed turns out even more dovish, the price of gold could catch its breath.
Thank you.
If you enjoyed the above analysis and would you like to know more about the gold ETFs and their impact on gold price, we invite you to read the April Market Overview report. If you're interested in the detailed price analysis and price projections with targets, we invite you to sign up for our Gold & Silver Trading Alerts . If you're not ready to subscribe at this time, we invite you to sign up for our gold newsletter and stay up-to-date with our latest free articles. It's free and you can unsubscribe anytime.
Arkadiusz Sieron
Sunshine Profits‘ Market Overview Editor
Disclaimer
All essays, research and information found above represent analyses and opinions of Przemyslaw Radomski, CFA and Sunshine Profits' associates only. As such, it may prove wrong and be a subject to change without notice. Opinions and analyses were based on data available to authors of respective essays at the time of writing. Although the information provided above is based on careful research and sources that are believed to be accurate, Przemyslaw Radomski, CFA and his associates do not guarantee the accuracy or thoroughness of the data or information reported. The opinions published above are neither an offer nor a recommendation to purchase or sell any securities. Mr. Radomski is not a Registered Securities Advisor. By reading Przemyslaw Radomski's, CFA reports you fully agree that he will not be held responsible or liable for any decisions you make regarding any information provided in these reports. Investing, trading and speculation in any financial markets may involve high risk of loss. Przemyslaw Radomski, CFA, Sunshine Profits' employees and affiliates as well as members of their families may have a short or long position in any securities, including those mentioned in any of the reports or essays, and may make additional purchases and/or sales of those securities without notice.
Arkadiusz Sieron Archive |
© 2005-2022 http://www.MarketOracle.co.uk - The Market Oracle is a FREE Daily Financial Markets Analysis & Forecasting online publication.