US Dollar – The Big Picture
Currencies / US Dollar Jan 03, 2017 - 01:32 PM GMTBy: Submissions
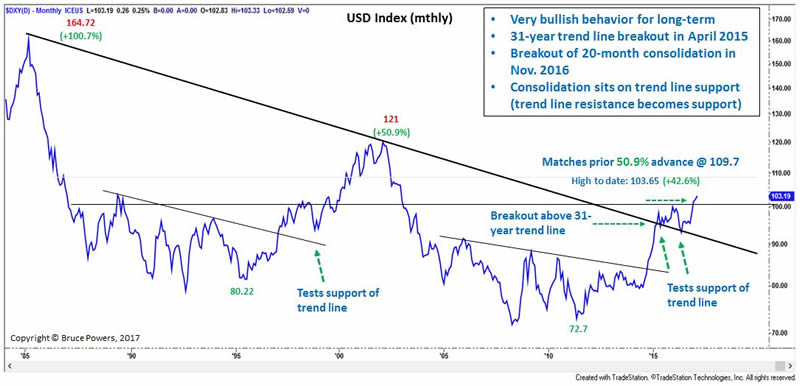
 The U.S. dollar index (DXY) continues to strengthen following very positive long-term bullish price behavior. Although retracements will be seen in the short-term, upward pressure should remain for some time.
Classic bullish trend continuation price behavior:
- Breakout above 31-year downtrend line in April 2015
- Consolidation at trend line support for almost 2 years
- Tests the line as support on multiple months and it holds
- Breaks out of 20-month consolidation range in November, and ends the month above the consolidation high. Breakout occurred above 100.51 (top of consolidation).
- Then in December the dollar closes at a new high, the highest monthly closing price since November 2002.
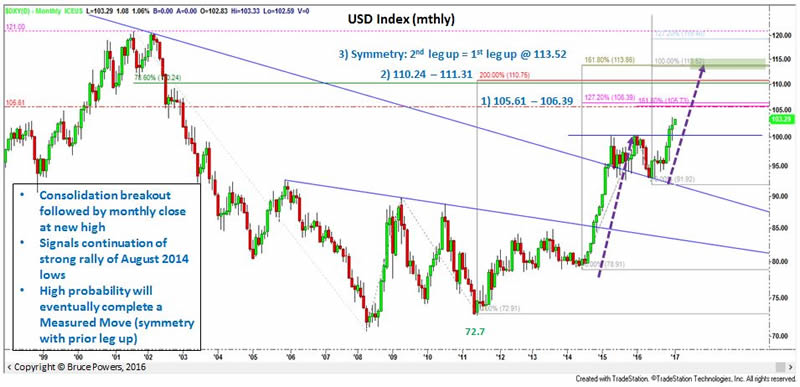
Several primary long-term targets are noted on the chart below. These targets are mostly identified by the confluence of multiple Fibonacci ratio measurements, including retracements, extensions and projections.
Target number 3 identifies the completion of a measured move, where the second leg up (see purple arrows) matches the appreciation of the first leg up. That target of 113.52 is further strengthened by the confluence of two Fibonacci levels close by. Frequently we see symmetry between swings in markets. Therefore, it wouldn’t be unexpected for the dollar to eventually complete the measured move, at a minimum. However, given that we’re looking at a monthly chart it could take some time.
The next key long-term price area to watch for potential resistance is from approximately 105.61 to 106.39. That price zone begins at a prior resistance peak from back in July 1989 and includes multiple Fibonacci price levels. That price zone is followed by a potential resistance zone from around 110.24 to 111.31, and includes the completion of a 78.6% retracement of the long-term downtrend at 110.34.
In addition, if we assume the current long-term uptrend matches the percentage appreciation of the prior move off the 1995 swing low at 80.22 we arrive at a potential minimum target of 109.70. (www.marketstoday.net/en/)
Bruce Powers, CMT
Chief Technical Analyst
http://www.marketstoday.net/
© 2016 Copyright Bruce Powers- All Rights Reserved
Disclaimer: The above is a matter of opinion provided for general information purposes only and is not intended as investment advice. Information and analysis above are derived from sources and utilising methods believed to be reliable, but we cannot accept responsibility for any losses you may incur as a result of this analysis. Individuals should consult with their personal financial advisors.
© 2005-2022 http://www.MarketOracle.co.uk - The Market Oracle is a FREE Daily Financial Markets Analysis & Forecasting online publication.


