


Gold and the SPX Stocks Bull Market
Commodities / Stock Market 2017 Dec 31, 2016 - 01:46 PM GMTBy: Tony_Caldaro

 The market started the week at SPX 2264. On Tuesday the market rallied to SPX 2274 in the opening minutes and then started to pullback. The pullback lasted all week, with one 9 point rally along the way, and hit SPX 2234 on Friday before bouncing to end the week at 2239. For the week the SPX/DOW lost 1.0%, and the NDX/NAZ lost 1.5%. Economic reports for the week were slightly positive. On the downtick: pending home sales, the Chicago PMI, plus the trade deficit increased. On the uptick: Case-Shiller, consumer confidence, the WLEI, plus weekly jobless claims decreased. Next week economic highlights: monthly payrolls, FOMC minutes and the ISMs. Happy New Year!
GOLD
To this observer the continued interest in Gold is reminiscent of the 1980’s. After a 10-year bull market, 1970-1980, when Gold soared from $35 to $873, it entered a 5-year bear market and dropped to $283 – losing 68% of its value. The problems of the tumultuous 1970’s had not completely disappeared by 1985, and many thought Gold was cheap, and a good safe haven against potential future economic problems. By 1988 Gold had risen to $507, retracing 38% of the entire bear market. But that would prove to be the highest price Gold would achieve for the next 17 years. So what went wrong? Actually nothing if one understands the Commodity, which includes Gold, long term cycles.
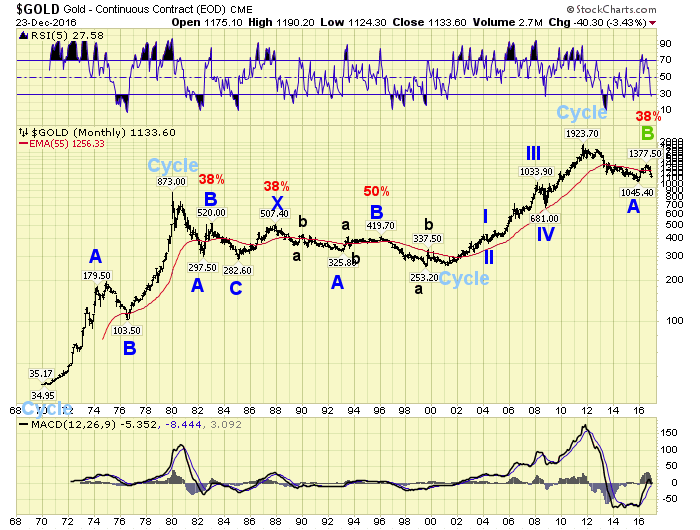
During the first nearly two centuries of the United States the price of Gold was relatively fixed. The USD was either backed by Silver, with a 15-1 or 16-1 Gold ratio, backed by Gold, or backed by both during a period of bimetallism. One would think with prices fixed over such a long period of time, it would be difficult to observe any sort of cyclical movement. But if one knows what to look for, it is there. In previous reports on Gold, and Commodities, we have noted an approximate 30-year cycle: a 10-year bull market followed by a 20-year bear market. In this report we are going to make it quite simple to observe, and historically confirm it.
We can all agree that Gold peaked in 1980 and 2011: 30-years apart 1 year. We can also agree that Gold bottomed in 1970 and 1999/2001: 30-years appear 1 year. Since the Gold price was fixed in the US for all but these last 45 years, only temporary peaks in prices, due to monetary demand, are likely to appear in any historical chart of Gold. If we then project back every three decades, starting with simply the 2010’s, we should see the cycle. The decades are the: 2010’s, 1980’s, 1950’s, 1920’s, 1890’s, 1860’s, 1830’s. Notice there was a small blip higher in the 1830’s due to the 1834 Coinage Act. There was a spike higher in the 1860’s due to the 1863 National Banking Act. There was also a spike higher in the 1950’s probably due to the 1948 Marshall Plan. The only other price blip on the chart, which is unaccounted for, was in the 1810’s. The 30-year cycle was even at work during a 200-year Gold price fix. This cycle suggests a Gold bull market will likely peak in 2040 1 year, after a bear market low in 2030 1 year. Until then Gold is likely to remain in a bear market trading range, similar to 1985-2001.
LONG TERM: uptrend
From the February 2016 SPX 1810 bear market low the market has risen, thus far, in three impulsive uptrends: February-April, June-August and November-December. The first uptrend was 2 months and about 300 SPX points, the second was 2 months and about 200 SPX points, and the current uptrend 1 month old and about 200 points thus far. The characteristics of this bull market suggest the current uptrend should extend into at least January, even though it has already reached about the minimum length for previous completed uptrends. The weekly RSI, however, has weakened with this week’s decline. As a result of these three characteristics, a completed, or near completed uptrend, should now be considered as a possibility.
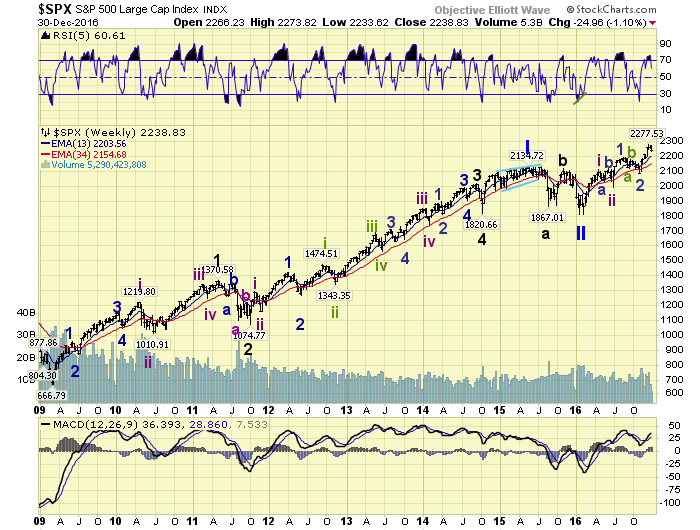
The first uptrend was labeled Intermediate wave i. The second uptrend was labeled Minor 1 of Intermediate wave iii. The current uptrend has been expected to be Minor 3 of Intermediate wave iii and about 300 SPX points. If it has already ended, or near completion, then it will be labeled as only Minute i of Minor wave 3. One lesser degree than anticipated.
MEDIUM TERM: uptrend
The current uptrend began in early November at SPX 2084. This advance thus far has been counted as three waves up with a fourth currently underway. However, this week we have considered that it could have been five waves up. The short term characteristics of this bull market are still not completely defined. Nevertheless we have tracked three waves up, with a fourth underway, . However, since we are dealing with possibilities/probabilities we offer other potential scenarios until the short term count clears.
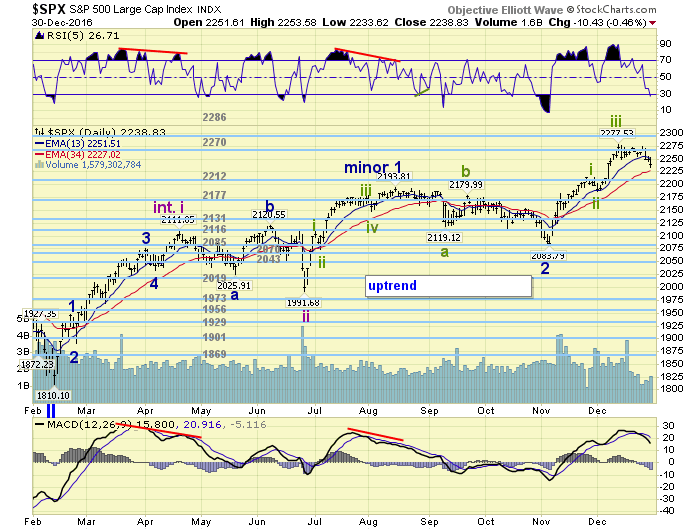
Should a downtrend/correction be underway it should be limited to the OEW 2177 pivot. As corrections thus far have been about 5%. Medium term support is at the 2212 and 2177 pivots, with resistance at the 2270 and 2286 pivots.
SHORT TERM
With the several variables noted in the previous sections we have decided to update the count to three Minute waves up to the uptrend high, and a Minute iv underway. This count suggests there is still one more high, Minute wave v, before this uptrend concludes. Also, since Minute iii was shorter than Minute i, there is a limit to the upside potential of Minute v. If we use SPX 2234 as a Minute iv low, the limit is SPX 2325.
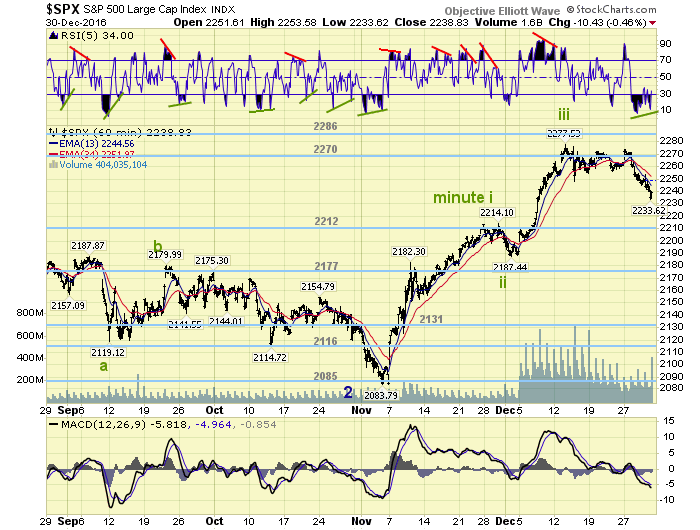
The current pullback has declined in many small waves, but basically three larger waves SPX: 2248-2274-2234. This pattern now looks like a complex zigzag. If SPX 2234 does not hold support then the next likely target is SPX 2225 – where wave c equals 1.618 wave a. Should the market drop down to the OEW 2212 pivot, then the uptrend may be over and a downtrend may be underway. The decline this week, as previously noted, offers many possibilities at this point. Short term support is at SPX 2225 and the 2212 pivot, with resistance at the 2270 and 2286 pivots. Short term momentum ended the week with an ongoing positive divergence. Best to your trading in the New Year!
FOREIGN MARKETS
Asian markets were mixed on the week and gained 0.6%.
European markets were also mixed and gained 0.2%.
The DJ World index lost 0.2%.
COMMODITIES
Bonds remain in a downtrend but gained 0.4% on the week.
Crude remains in an uptrend and gained 1.3%.
Gold is trying to uptrend and gained 1.6% on the week.
The USD remains in an uptrend but lost 0.7%.
NEXT WEEK
Monday: Holiday. Tuesday: construction spending and ISM at 10am. Wednesday: auto sales and the FOMC minutes. Thursday: weekly jobless claims, the ADP and ISM services. Friday: monthly payrolls and factory orders.
CHARTS: http://stockcharts.com/public/1269446/tenpp
After about 40 years of investing in the markets one learns that the markets are constantly changing, not only in price, but in what drives the markets. In the 1960s, the Nifty Fifty were the leaders of the stock market. In the 1970s, stock selection using Technical Analysis was important, as the market stayed with a trading range for the entire decade. In the 1980s, the market finally broke out of it doldrums, as the DOW broke through 1100 in 1982, and launched the greatest bull market on record.
Sharing is an important aspect of a life. Over 100 people have joined our group, from all walks of life, covering twenty three countries across the globe. It's been the most fun I have ever had in the market. Sharing uncommon knowledge, with investors. In hope of aiding them in finding their financial independence.
Copyright © 2016 Tony Caldaro - All Rights Reserved Disclaimer: The above is a matter of opinion provided for general information purposes only and is not intended as investment advice. Information and analysis above are derived from sources and utilising methods believed to be reliable, but we cannot accept responsibility for any losses you may incur as a result of this analysis. Individuals should consult with their personal financial advisors.
Tony Caldaro Archive |
© 2005-2022 http://www.MarketOracle.co.uk - The Market Oracle is a FREE Daily Financial Markets Analysis & Forecasting online publication.