


Gold Price Due for a Bounce, But Remains in Long-term Bearish Trend
Commodities / Gold and Silver 2016 Dec 27, 2016 - 12:52 PM GMTBy: Submissions

 Bruce Powers writes: Spot gold (XAU/USD) remains in a long-term downtrend following a test of resistance at the long-term downtrend line over multiple weeks from July to September, and then again in November. A swing high of $1,375.15 was reached during that time, which was also a 2016 high and the highest price since March 2014.
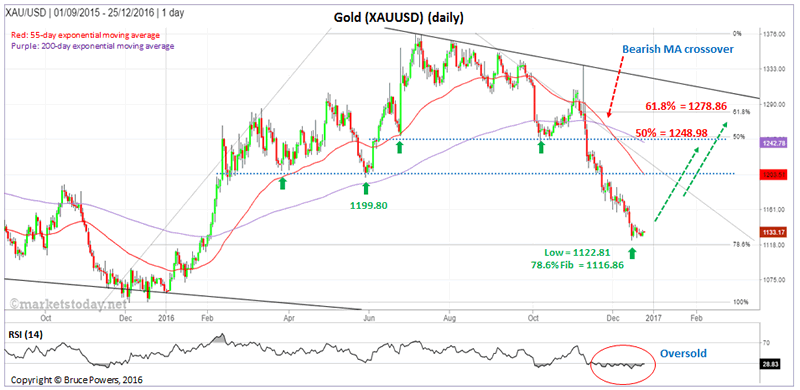
Eventually buyers capitulated and the precious metal fell decisively for six weeks until hitting a low of $1,122.81 two weeks ago. Essentially, that decline completes a 78.6% Fibonacci retracement ($1,116.86) of the uptrend begun from the 2015 low. Although there is no real bullish divergence on the 14-day RSI so far it has been oversold for the past month.
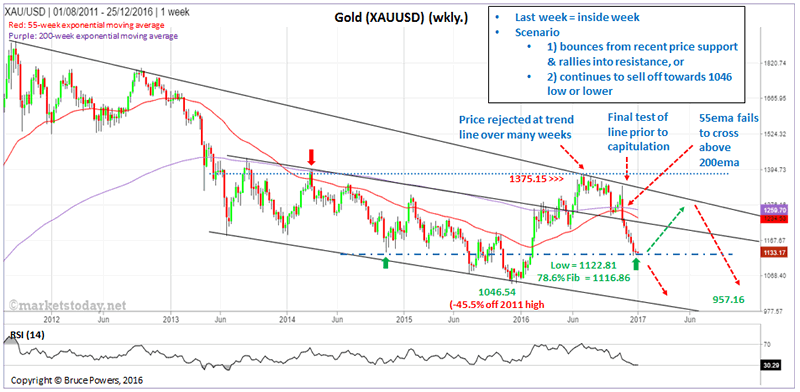
Until proven otherwise the long-term downtrend can be anticipated to continue - eventually.
- Price remains below the long-term downtrend line
- 55-week exponential moving average (ema) was unable to cross back above the 200-week ema. It has remained below the 200-week ema since December 2013.
- Price got above the 200-week ema for much of 2016 after falling below it in 1Q 2013, but is now decisively back below the 200-week ema.
Near-term positive
Regardless, given the analysis in the first paragraph above, in the near-term there is a reasonable chance for a decent bounce, and possibly another test of resistance of the long-term downtrend line. Fibonacci retracements of the current short-term decline can be used as potential targets and to correlate with the downtrend line once it is approached. The 50% retracement level is at $1,248.98, and the 61.8% price level is at $1,278.86, and can be seen on the following chart.
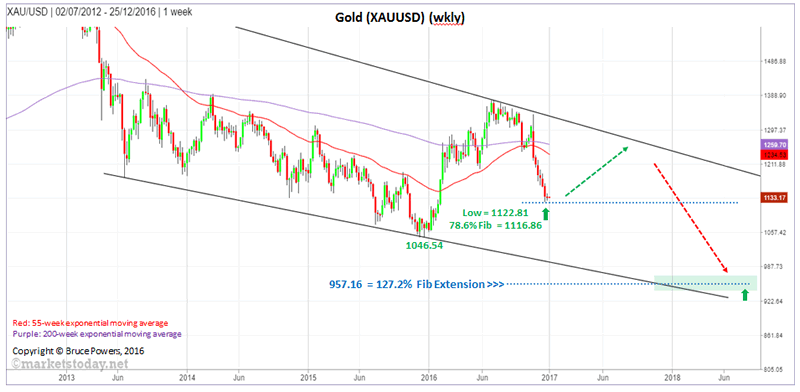
Long-term lower target at 127.2% Fibonacci extension
If the long-term downtrend remains intact going forward and the 2015 low of $1,046.54 is eventually exceeded to the downside gold could easily reach the 127.2% Fibonacci extension of the uptrend off the 2015 low. That extension is at $957.16 and is a minimum lower target. (www.marketstoday.net/en/)
Bruce Powers, CMT
Chief Technical Analyst
http://www.marketstoday.net/
© 2016 Copyright Bruce Powers- All Rights Reserved
Disclaimer: The above is a matter of opinion provided for general information purposes only and is not intended as investment advice. Information and analysis above are derived from sources and utilising methods believed to be reliable, but we cannot accept responsibility for any losses you may incur as a result of this analysis. Individuals should consult with their personal financial advisors.
© 2005-2022 http://www.MarketOracle.co.uk - The Market Oracle is a FREE Daily Financial Markets Analysis & Forecasting online publication.