Dow 20k Mission Accomplished, Stocks Bull Market Delights Could Have Violent Bear Market Ends
Stock-Markets / Stock Market 2017 Dec 22, 2016 - 08:58 AM GMTBy: Nadeem_Walayat
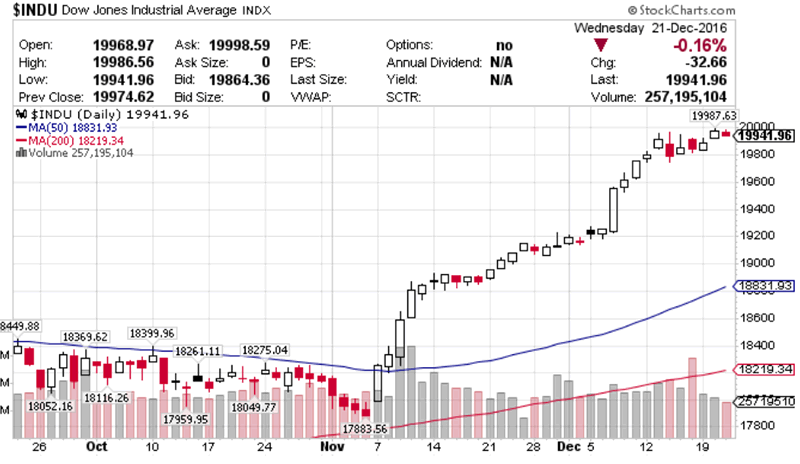
 Today (21st December) the Dow again traded within a whisker of the mega stocks bull market milestone of 20,000 by hitting a high of 19,987 before retreating to close at 19,942, up 15% on the year and 9% since Trumps election win, and I just cannot wait any longer for those extra 13 points to materialise before publishing this analysis.
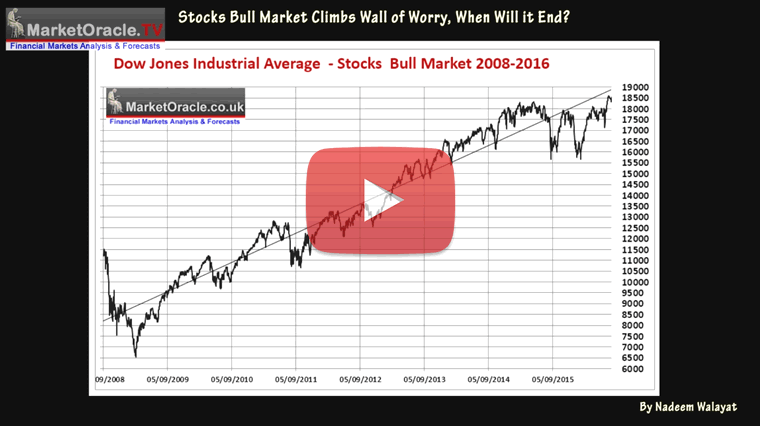
This stocks bull market has now risen by some 13,500 points since the last bear market bottomed at Dow 6,470 in March 2009, at THAT time I concluded to expect a multi-year bull market, a stocks stealth bull market, at the time I imagined that it would be a stealth bull market for perhaps its first 18 months or so before the commentariat started to realise that stocks had entered into a new bull market. Instead the stealth bull market continued for 4 full years all the way to NEW ALL TIME HIGHs, all whilst the clueless consensus had been that it was a bear market rally that MUST resolve in a resumption of bear market given the dire economic consequences courtesy of an ongoing financial crisis, and the resulting economic depression that became a perpetual perma bear mantra that I have often ridiculed.
15 Mar 2009 - Stealth Bull Market Follows Stocks Bear Market Bottom at Dow 6,470 (169,913 Reads)
Wide spread consensus today exists for SHARPLY LOWER CORPORATE EARNINGS going into 2010 THAT MUST MEAN MUCH LOWER STOCK PRICES. However this earnings analysis that is so abundant today, should have been presented OVER A YEAR AGO ! in October 2007 I.e. at or near the market peak! So that ordinary investors could actually ACT on the information. NOT NOW AT THE MARKET BOTTOM ! We are again seeing REASONS as to WHY INVESTORS should avoid investing INTO the Stealth Bull market!, precisely as we all witnessed what was effectively Bullish propaganda during the final stages of the Stocks Bull Market, so we are NOW witnessing what is effectively BEARISH propaganda in the final stages of the Bear Market. Now, don't get me wrong, I am not saying that the analysis is not genuine, what I am saying is that IT IS IRRELEVANT! As it is always much easier to build a scenario in favour of a trend that has been in force for sometime that has generated much data and analysis in support of why it exists and therefore it should continue for much longer, then to "Think Out side of the Box" to disregard bearish data that has been magnified by the growing consensus that really should have been known more than a year earlier in favour of the technical picture that as the analysis of October 2008 stated, that a. we are NOT heading for a Great Depression (as I will further elaborate upon in the Q&A below) and b. The stocks bear market HAS fulfilled its bear market objectives in terms of price and time, more than anyone could have been imagined a year ago!
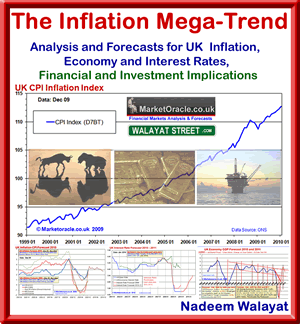
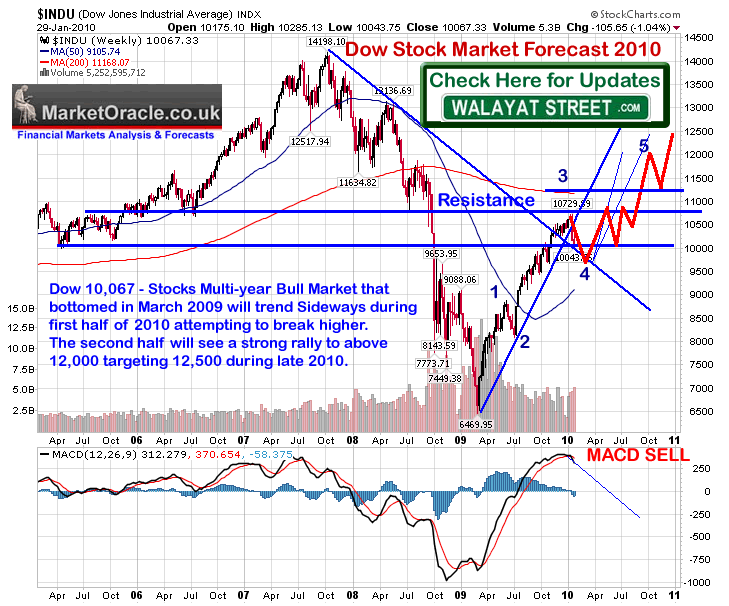
And so the bear market rally mantra continued by the mass of analysts (salesmen) and the pseudo-analysts (journalists) from 2009 into 2010 where at the start of 2010 I published my first ebook "The Inflation Mega-trend" (Free download) that warned to expect the stocks stealth bull market to continue for the whole of 2010 and continue for far longer and higher than anyone could imagine at the time which since has remained my consistent message.
| Stocks Stealth Bull Market | |
| 2009 The Year of the Stocks Stealth Bull Market | |
| Economic Forecasts Applied to the Stock Market | |
| Stock Market Mega-Inflationary Trend | |
| Market Manipulation | |
| Stock Market Crash Again? | |
| Technical Analysis | |
Stock Market 2010 Trend Forecast Conclusion |
|
| Stocks and Sectors Investing | |
| Dividends Investment Strategy | |
| Metals and Mining Sector | |
| Oil and Gas Sector | |
| Technology Sector | |
| Utilities Sector |
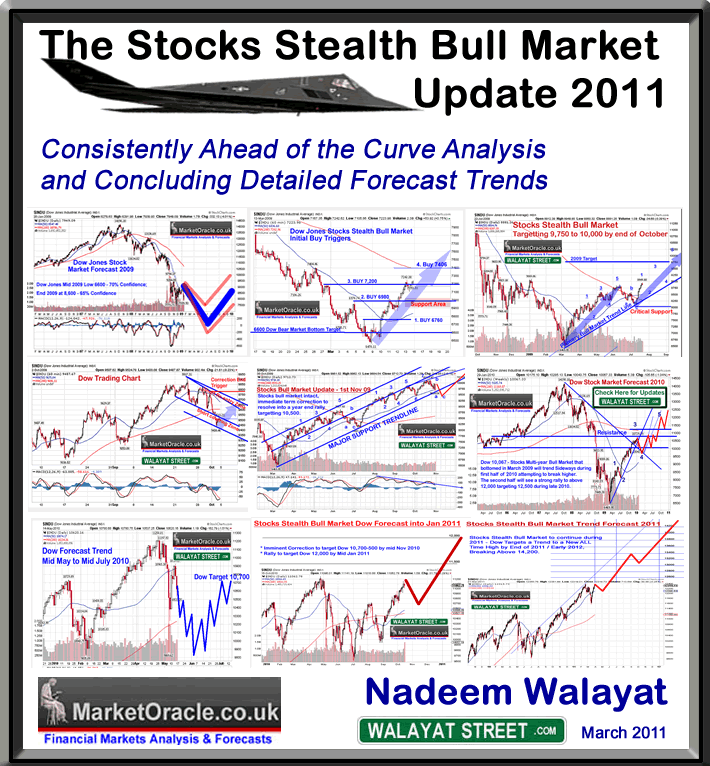
As expected the stocks stealth bull market continued into 2011 prompting my second ebook "Stocks Stealth Bull Market Update 2011" in March 2011
Download Now- Ebook (PDF 2.8meg)
CONTENTS
| Introduction | 1 |
| Why a Stocks Stealth Bull Market? | 2 |
| 2009 - Birth of the Stocks Stealth Bull Market | 2 |
| 2010 - Bull Market Consolidates and Targets 12,000 | 9 |
| Bear Market Rally Mantra Repeatedly Busted | 13 |
| The Head and Shoulders Propaganda Pattern | 14 |
| Hindenberg Crash Omen Proved to be the Summers Best Contrary Indicator! | 15 |
| Economy & Inflation Conclusions Applied to the Stock Market | 16 |
| Stock Market Mega-Inflationary Trend | 18 |
| Rising Interest Rates Implications for the Stock Market | 19 |
| Black Swan Events - Japanese Tsunami and Nuclear Meltdown | 26 |
| Crude Oil Price Impact on Stock Market Trends | 30 |
| The Copper Price and the Stock Market Trend | 32 |
| Stock Market Manipulation | 33 |
| Current Stock Market Sentiment & Psychology | 34 |
| Quantitative Easing AKA Money Printing | 35 |
| U.S. Dollar and Stock Market Trend Relationship, Currency and Real Wars | 37 |
| Stocks Stealth Bull Market Elliott Wave Analysis | 40 |
| Stock Market Technical Analysis | 44 |
| Formulating a Stock Market Conclusion for 2011 | 47 |
| STOCK MARKET FORECAST 2011 FINAL CONCLUSION | 49 |
| Risks to the Forecast | 50 |
| The SHOCK MARKET BUBBLE | 50 |
| The Stocks Stealth Bull Market Mega-trend | 50 |
| FTSE 100 Stocks Index Forecast 2011 | 51 |
| Emerging Markets Outlook 2011 | 52 |
| CHINA | 54 |
| INDIA | 57 |
| RUSSIA | 59 |
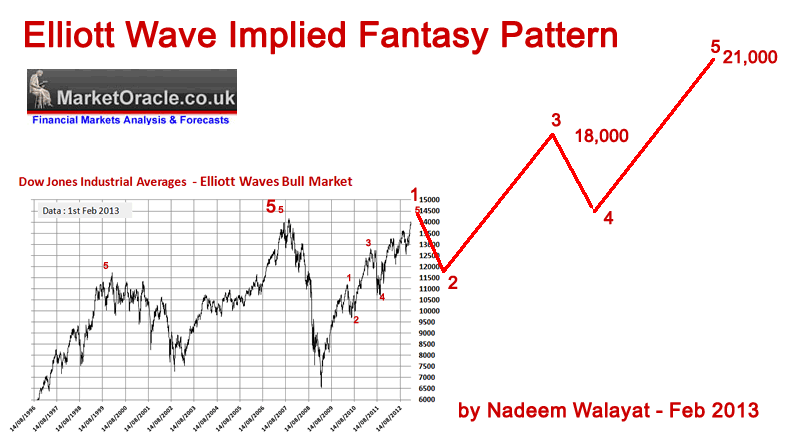
The stealth bull market continued into 2012, and 2013, prompting my last stocks stealth bull market ebook in Feb 2013 reiterating the point that the bull market would continue for far longer and higher than anyone was imagining at the time . (download for free)
Excerpts from my Feb 2013 stocks stealth bull market ebook:
Fundamental Inflationary Background
The fundamental background remains of ever expanding waves of highly inflationary central bank money printing liquidity that washes over all markets. Deflationists such as Krugman and his disciples bang on and on about deflation, about destruction of demand that will result in deflation, about debt deleveraging that will result in deflation. What the deflationists remain blind to is the fact that the central banks such as the Fed, and the Bank of England have been stuffing every orifice of the deleveraging banks with free money, the US alone has stuffed its banks with over $2 trillion of support which results in artificial profits as the banks risks / debts have been systematically transferred to the central banks balance sheets. Which is WHY FALLING DEMAND and FALLING WAGES are NOT resulting in Deflation! because in totality there HAS BEEN NO DEBT DELEVERAGING, TOTAL DEBT IN FACT CONTINUES TO EXPAND as central banks MONETIZE GOVERNMENT DEBT and in some cases EXPOENENTIALLY. And not only that but money printing AKA QE is far worse for an economy than Debt money (bank created credit) because it REALLY has just been conjured out of thin air with no economic activity to justify its creation.
This is why prices WILL rise, ALL prices including asset prices because of central bank QE which should not just be seen as free money for the banks but direct deliberate debasement of the currency. Unlike bank credit It WILL NEVER be destroyed instead feeds the Inflation Mega-trend which I termed in March 2009 as QE really being Quantitative Inflation. I know this may be getting rather complicated, so if you want to understand only one thing, know this that money printing by central banks is highly inflationary, highly corrosive to the purchasing power of a currency, which is why despite all of the academic reasons why we 'should' have deflation in reality we have INFLATION.
The Exponential Inflation Mega-trend
The US and every other nation is emerged in what is an exponential inflation mega-trend which the below graph clearly illustrates that even on the official CPI inflation measure (which tends to under report real inflation), that the US is no different to any other country which contrary to the delusional deflation propaganda is instead immersed in what has always been an exponential inflation mega-trend where vested interests have instead been blindly regurgitating the threats of deflation ever since the Great Recession of the 2008-2009, which the graph clearly illustrates amounted to nothing more than a mere blip or as I warned of at the time as being a mere deflationary ripple on the surface of an ocean of Inflation.
On the basis of the probable simple pattern being for a 5th of a 5th, then this analysis further concludes that the termination point for the 5th of a 5th is a Larger Wave 1 and therefore implies a further 2 Larger Impulse waves 3 and 5 as the following graph illustrates -
Peering into the Mists of Time
If you have actually read the whole of this analysis (rather than just skipping to the conclusion) then the message you will get is one of an ongoing stocks bull market that like a coiled spring is prepping itself to propel the stock market to levels that cannot be imagined today I.e. my Elliott Wave and broadening top analysis gives strong indications for longer-term expectations. For instance, I can easily see the Dow trade at 20,000 during 2017, so expect plenty more Stocks Stealth Bull Market ebook's to follow.
And in that ebook I attempted to pear into the mists of time penciling the rough trend I imagined the Dow would run over the coming years, estimating that the Dow would likely hit 20k during the first half of 2017 which is where we stand today.
Stocks Bull Market of 2016
My consistent view all year has been that the Dow would trade to a series of new highs during the second half of 2016 and that ultimately the Dow targeted a trend to 20k, which my analysis of 14th November concluded would probably occur BEFORE the end of this year.
See my series of videos for taste of this years analysis and with more plenty articles in my articles archive (http://www.marketoracle.co.uk/UserInfo-Nadeem_Walayat.html).
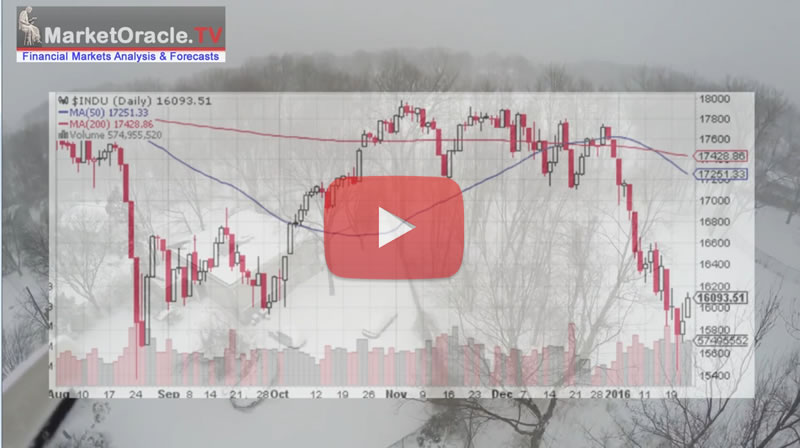
26th Jan 2016 - Dow 16,093
2nd March 2016 - Dow 16,685
17th May 2016 - Dow 17,710
7th August 2016 - Dow 18,500
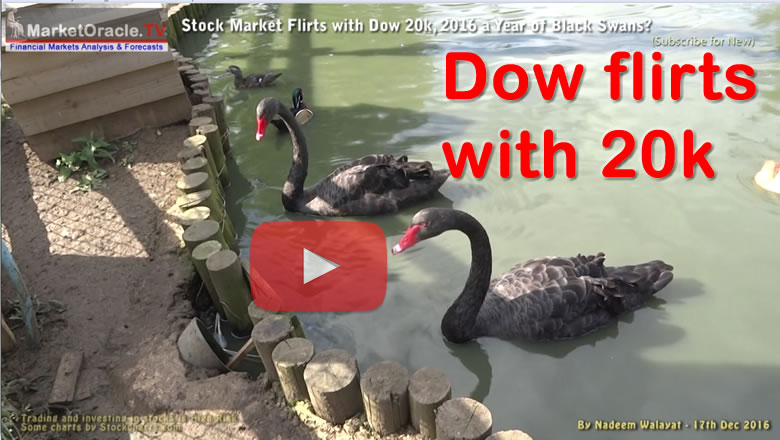
19 Nov 2016 - Dow 18,905 - Trump Delirium Triggers Stock Market Brexit Upwards Crash Towards Dow 20,000!
Now I know you all want me to promptly trundle out my forecast conclusion for the Dow for 2017. However, as my most recent video analysis pointed out that in my consistent opinion, Technical Analysis (TA) is a RED HERRING. Which means so as to arrive at that which is the most probable involves two critical precursor steps, that of the mega-trends and that of personal risk vs reward i.e. putting my money where my mouth is as I elaborated in the following recent video.
Mission Accomplished
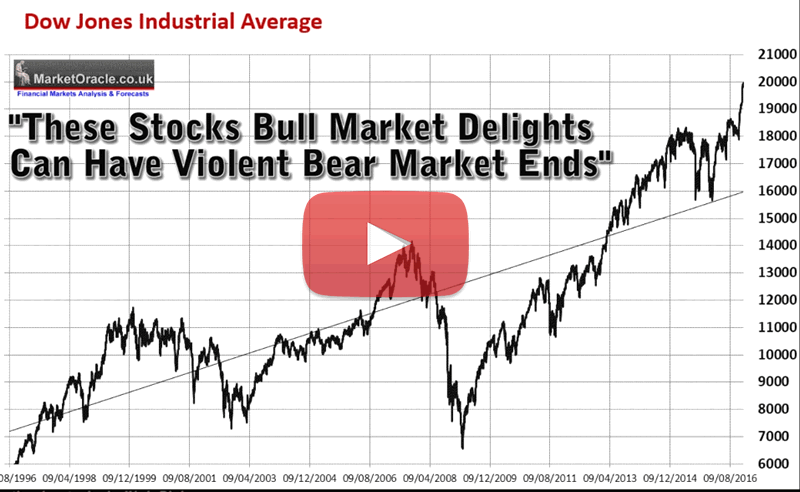
So now here we stand today with the Dow hovering virtually at Dow 20k. You might imagine that I am feeling euphoric, high fiving everyone I meet and great, grinning from ear to ear. But actually it's not so... find out why as this analysis continues in my most recent video of why I feel more like one of those Westworld host robots, as though I am awakening from a near 8 year stocks bull market dream and realising...
"These Stocks Bull Market Delights Can Have Violent Bear Market Ends"
Ensure you are subscribed to always free newsletter for my forthcoming in-depth mega-trend analysis and market forecast conclusions as I attempt to make sense of the "Trump Reset".
Source and comments : http://www.marketoracle.co.uk/Article57624.html
By Nadeem Walayat
Copyright © 2005-2016 Marketoracle.co.uk (Market Oracle Ltd). All rights reserved.
Nadeem Walayat has over 25 years experience of trading derivatives, portfolio management and analysing the financial markets, including one of few who both anticipated and Beat the 1987 Crash. Nadeem's forward looking analysis focuses on UK inflation, economy, interest rates and housing market. He is the author of five ebook's in the The Inflation Mega-Trend and Stocks Stealth Bull Market series that can be downloaded for Free.
 Nadeem is the Editor of The Market Oracle, a FREE Daily Financial Markets Analysis & Forecasting online publication that presents in-depth analysis from over 1000 experienced analysts on a range of views of the probable direction of the financial markets, thus enabling our readers to arrive at an informed opinion on future market direction. http://www.marketoracle.co.uk
Disclaimer: The above is a matter of opinion provided for general information purposes only and is not intended as investment advice. Information and analysis above are derived from sources and utilising methods believed to be reliable, but we cannot accept responsibility for any trading losses you may incur as a result of this analysis. Individuals should consult with their personal financial advisors before engaging in any trading activities.
Nadeem Walayat Archive |
© 2005-2022 http://www.MarketOracle.co.uk - The Market Oracle is a FREE Daily Financial Markets Analysis & Forecasting online publication.


