


US DEBT - A Total Disregard For Fiscal Responsibility
Interest-Rates / US Debt Dec 18, 2016 - 12:53 AM GMTBy: Andy_Sutton

 While we aren’t sure the coast is clear – yet – the show must indeed go on. There are topics that need to be discussed. Now with the whole new concept of ‘fake news’ out there for the sole purpose of discrediting anything the establishment wants off the radar we’re going to have to ask you to look at the decade’s worth of work that has been poured into this column and decide if we are fake or not.
For the sake of honesty, it must be pointed out that the mainstream media, in a classic false flag type move, created the whole idea of fake news with its own ridiculous material, then used the whole stunt to say ‘see, we need to be careful because there are lots of phonies out there’. Darn right there are. We’ll allow that there are quite a few shills in the alternative media. Their betrayal will be exposed in time, but for the most part the phonies have three letter network affiliations attached to them.
That said, we are going to take a dangerous path this week. We’re going to mix the economic with the political since (unfortunately) politics and politicians are the faces of economic policy. Our goal this week is simple. We’re going to point out the national debt and look at it in a slightly different way from how it is normally analyzed. We’re going to look at it in terms of the political sway and some significant events that took place during four year periods – specifically, the four year Presidential cycles. Since most of the people in this country seem to think the President runs the country, we’re going to use Presidential terms of office as demarcation lines in our study.
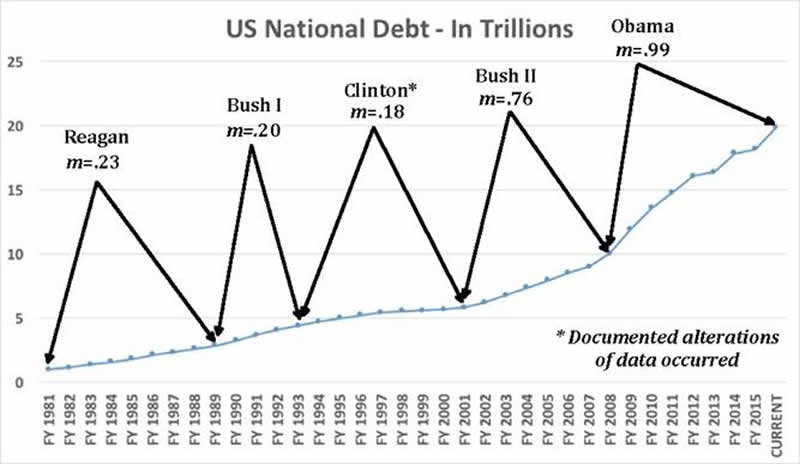
The source for all of the data is www.treasurydirect.gov, the USTreasury’s very own website where they peddle their bonds and provide statistical analysis and data, the national debt being one of the series they maintain. Many people are aware of the fact that it took the United States more than 200 years to accumulate its first trillion in national debt. This happened by the end of the 1982 fiscal year (9/30/1982). All data points given will be as of the end of the fiscal year mentioned for consistency. Your authors were in 6th and 9th grade at the time we crossed the $1T mark. At the time, a trillion dollars was unheard of. Billions were a lot. Fast forward thirty years and change and billions are pocket change and trillions aren’t really that big of a deal. Hey, we’re just $20T in hock, no big deal, right? We can get that cleaned up pretty quick; we’re the most powerful and richest country on Earth, right? Go on believing that and you’ll secure your place in history as being one of the group who lost America.
1981-1989 – The Reagan Years
Like Richard Nixon, Ronald Reagan, through no fault of his own, will forever have a dubious legacy. Nixon was in the unenviable position of taking the US off the gold standard. Reagan’s plight is similar in that it is also economic. It was under his watch that the national debt crossed the $1T mark for the first time. When Reagan entered office in 1981, the debt stood at $.9978 trillion. By the time another 365 days had passed, the threshold was crossed. The first doubling after crossing the trillion-dollar mark took place at the end of FY 1986 when the debt went from $1.142 trillion in 1982 to $2.125 trillion by 1986. For the first 6 years of Reagan’s Presidency, Congress was split: Republicans held control of the Senate, Democrats held control of the House. In the mid-term elections in 1986, however, the Democrats gained control of the Senate as well. The major economic/geopolitical events of the time were the S&L debacle and the Iran/Contra affair. Despite being lauded as a great conservative, Reagan was left holding the bag on two very negative events: the national debt crossing the trillion-dollar mark for the first time and the doubling of the debt just 4 years later. When the 1989 fiscal year concluded after Reagan left office, the debt stood at $2.875 trillion. This represented an increase of 188% during Reagan’s tenure. Don’t worry conservatives, we aren’t out to excoriate your hero, but more to illustrate how little control the office of President really has over such matters.
1989-1993 – Geo. H.W. Bush (Daddy Bush)
George Herbert Walker Bush’s Presidency is exemplified by two themes. The first was the emergence of the Gulf War against Saddam Hussein and Bush’s pledge ‘Read my lips – no new taxes’. Looking back, we can see what an awful joke this administration was. We’re still playing in the sand 10,000 miles away 26 years later and Bush almost immediately reneged on his promise of no new taxes. Bush also publicly coined the term ‘New World Order’ and had his membership to the NRA revoked and his $500 returned for stabbing gun owners in the back. Bush operated with both the House and the Senate in control by the Democrats. The $2.875 trillion in debt that Bush ‘inherited’ swelled to $4.411 trillion by the end of FY 1993; after Bush had left office. The change represented a 53% increase in the national debt during Bush’s tenure.
Concluding this 12-year period during which there was a Republican President, the national debt went from $.9978 trillion in 1981 to $4.411 trillion in 1993, an increase of 342%. Much of the blame is generally placed at the feet of the Democratic party since it either had control of Congress or at worst had a split between the two Houses of Congress during this 12-year stretch. People can argue about that forever; we’re not going to. We’ll make our points after the analysis is complete.
1993 – 2001 - Bill ‘Slick Willie’ Clinton
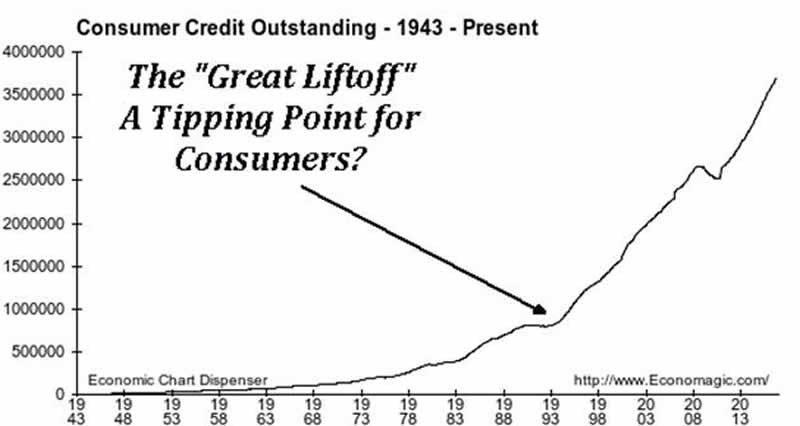
The Clinton years were marked by some big economic changes that mostly took place below the surface. First, consumer borrowing (for whatever reason) absolutely skyrocketed starting in 1993 and has never stopped since. Also, the BLS changed the methodology for how it calculated unemployment to present a more pleasing result. America also got into a serious cooking of the books, which explains the ‘surpluses’ of the Clinton years. Our government decided that if it didn’t like a particular balance sheet, it would just remove items from said balance sheet with the net effect being a more pleasing result.
From the perspective of the national debt, Clinton inherited $4.411 trillion in national debt and under his watch, the numbers saw another significant increase – to $5.807 trillion; a comparatively modest increase of 32%. Keep in mind the book cooking that went on during this time. It becomes more obvious as we move forward.
2001- 2009 – George W. Bush (Bush the Lesser)
The Bush years saw many crises. The 8 years started in crisis as the dot com bubble unravelling continued. Then there was 9/11 and the unconstitutional laws and regulations that came as a result. The economy was generally a mess and the not-so-USFed was doing its best to blow up bubbles and succeeded in blowing up a massive real-estate bubble. There was also the passage of Medicare Part D – the prescription drug portion of Medicare, which completely and forever doomed Medicare and erased forever any doubt that it would be dead on arrival for the next generation. The housing bubble burst in 2006-2007 and next we saw banks start to drop like flies at a RAID demonstration. Bush’s 8 years ended with the Congress giving Treasury Secy Paulson three quarters of a trillion dollars to buy troubled assets and Paulson thanked them by turning around and giving the money to his banker buddies. Oh, for the record, Paulson was a former CEO of Goldman Sachs. This is another theme that must be monitored at the present time as the Goldman boys are finding their way into the new administration, polluting it from the outset.
Bush ‘inherited’ $5.807 trillion in terms of the national debt and managed to run it up to $11.909 trillion is just 8 years; an increase of 105%. Another doubling, only the numbers are starting to get really big now. Bush had a split Congress when he took office, the Republicans controlled Congress from 2003-2007 as the Republicans were summarily dismissed during the 2006 mid-term elections. The Democrats finished the Bush years in control of both Houses of Congress. Ironically, the promises that got the Democrats elected in 2006 – namely going after Bush for the whole Iraq/Afghanistan situation - were never fulfilled, much as the Republicans’ ‘Contract with America’ in 1994 was also unfulfilled. There is a steady theme here and we can draw plenty of conclusions as we once again go through the motions of switching power.
2009 – Present – Barry Hussein Soetoro-Obama
The Obama years were much like the Bush years – unfulfilled promises to remove the troops from Iraq, deficit spending, and a transparent government that seemed more like a brick wall than a window. Did we mention deficit spending? Obama campaigned against pretty much everything Bush did, including how he had his hair done and then went on to either continue or broaden almost everything his predecessor did. Economic policy during this time was as deplorable as ever with a heavy dose of socialistic tendencies thrown into the mix. Really, did we forget to mention deficit spending?
Again, we only bring this up so people are aware and perhaps pay attention to what happens over the next year or so. Now is no time to fall into a geoeconomic/political slumber. Obama started his two terms with the Democrats in control of both houses of Congress, lost the House in the 2010 mid-term elections, never to regain it, and then proceeded to lose the Senate as well in the 2014 mid-term elections.
Obama’s reign has been fraught with economic turmoil. The second great depression, which started on Bush’s watch, continues to this day – unless you’re reading government tabloid-like propaganda. It’s the recession that never ended. Spending was undertaken at all levels, from the government sending out checks to Americans to ‘stimulate’ the economy, to ‘shovel-ready’ projects reminiscent of FDR’s misguided tactics, to massive federal, state, local, and household deficits.
Obama ‘inherited’ $11.909 trillion in national debt from Bush the Lesser, and while the numbers for his reign of terror on the US fiscal situation has yet to end, the total as of the end of FY 2015 was a whopping $18.150 trillion and as of today stands at $19.878 trillion. It will undoubtedly cross $20 trillion and perhaps even the $21 trillion mark by the time FY 2016 is over. Going by today’s number, the increase represents a 67% increase. Smaller by percentage, but under Obama the national debt grew by roughly a trillion each year. Let’s consider again that it took the US 206 years to run up its first trillion in debt. Now we’re adding a trillion a year.
Since 1980, we’ve seen pretty much every combination in terms of how the power between the two major parties has been distributed. Democratic Presidents and Republican Congresses, Republican Presidents with Democratic Congresses, and many combinations in between. However, since we began the analysis with 1981 and Reagan in the Oval Office, there has NOT ONE TIME in the 36 subsequent years been an instance in which the national debt decreased.
Even the accounting chicanery of the middle of Clinton’s two terms aside, all the cooking of the books could do was slow the accumulation of debt. There were no surpluses. Remember, this data comes directly from the government; you can check it out for yourself here.
The point of all of the aforementioned preamble was to point out that there hasn’t been a single administration or combination of the two major parties in various dominant positions in the government that has resulted in progress towards paying off our debt. None. To even get close we had to fudge the numbers in a big way. So let’s dispense with the baloney that party A is fiscally responsible while party B isn’t, etc. Let’s get past the ‘This President was so good and we had prosperity during his time’ while lambasting both his predecessor and his successor. Fiscally, all of these administrations and their Congresses stank. Politicians by nature like to buy votes by making promises. These promises cost money. Some of them cost a lot of money. They want everyone to love them and vote for them so they can stay in power and ensure themselves a lavish lifestyle once we are finally able to get rid of them. A whorehouse is a cleaner and more honest enterprise than Washington, DC.
Looking at the graphic above, it is easy to see how the slope (m) has rather consistently increased through the present time where the slope is almost 1; a trillion dollars a year added to the debt. We placed an asterisk next to the Clinton years because his slope should have been much higher and if in fact we had honest numbers, it would be. The linked article does a reasonable job explaining why Clinton gets an asterisk.
Conclusions
We’ll leave you to form your own conclusions about the information presented above. Maybe you’ll remain stuck in the Diet Pepsi/Diet Coke paradigm, but we think we’ve made the solid point that America needs genuine change – across all levels. This is not just a government problem. Consumers have been even more profligate in living beyond their means than the government that aims to keep them satiated by hook or by crook. The issue of the national debt spiraling out of control is a systemic one. It has almost nothing to do with which stuffed shirt occupies which office, be it the White House, or one of the Houses of Congress. To an extent the national debt is a mathematical construct, which is the consequence of ending a purer relationship with honest money (gold) and opting instead for a fiat money system which requires a war machine to back it up.
A return to the gold standard would be ideal, however, we believe America doesn’t have the courage to do so. The people, despite the fleecing of 2008, haven’t endured anything close to the amount of pain that would cause them to even have a second thought about the way we are all living. As the financial community and media whip everyone into a frenzy about Dow 20K and how great the economy is and so forth, the notion of making a drastic change and inflicting intentional pain while making such a change seems almost sadistic, when it is, in fact, necessary. Necessary, that is if we want to preserve even a small slice of the America that was for our children and future generations. How bad do we as a nation want it and more importantly, how bad do you want it?
Graham Mehl is a pseudonym. He currently works for a hedge fund and is responsible for economic forecasting and modeling. He has a graduate degree with honors from The Wharton School of the University of Pennsylvania among his educational achievements. Prior to his current position, he served as an economic research associate for a G7 central bank.
By Andy Sutton
http://www.andysutton.com
Andy Sutton is the former Chief Market Strategist for Sutton & Associates. While no longer involved in the investment community, Andy continues to perform his own research and acts as a freelance writer, publishing occasional ‘My Two Cents’ articles. Andy also maintains a blog called ‘Extemporania’ at http://www.andysutton.com/blog.
Andy Sutton Archive |
© 2005-2022 http://www.MarketOracle.co.uk - The Market Oracle is a FREE Daily Financial Markets Analysis & Forecasting online publication.