Why Market, Economic Collapse isn't on the Menu
Economics / Economic Collapse Dec 14, 2016 - 12:11 PM GMTBy: Clif_Droke
 The word "collapse" instantly conjures primal feelings of both fear and excitement whenever we hear it. We fear it because it evokes our collective belief that collapse is fatal and final, yet it excites our imagination to the possibility, however, remote, that perhaps we'll be among the lucky few to survive and even prosper from it.
Whether in reference to a financial market crash or the collapse of government, the very idea has given birth to a plethora of writings on the subject. Indeed, some of the top selling books in the financial literature category in recent years have had collapse as the subject matter, for writers instinctively know they can always count on a visceral reaction from their readers whenever they write of it.
Laying aside the fear it evokes, the study of collapse is a fascinating and rewarding endeavor. Historians have long known what financial writers have only recently discovered, viz. that writing about collapse is a lucrative industry. Consider the hundreds of books dedicated to the decline and fall of the Roman Empire, or to any number of past civilizations (Aztec, Egyptian, Babylonian, etc.). One of the great preoccupations of writers of this genre is the guessing game of what exactly causes a society, or an economy, to collapse. There is invariably no consensus among historians as to how, or even when exactly, it happens.
Consider the famous example of ancient Rome. What was it that actually precipitated the decline and fall of this mighty empire? While there have been hundreds of reasons offered by specialists as to the cause(s), the most commonly assigned factors can be generally summarized as follows: 1.) Immigration and assimilation of foreigners (i.e. barbarians), 2.) Failure to continue expanding the frontiers via military conquest, 3.) Loss of personal discipline and liberty; 4.) Corruption on both the administrative and personal levels.
Even if we accept any, or all, of these reasons as being legitimate, it still doesn't answer the perennial question of what led the Romans to decide on making such a fateful decision. In other words, what was the ultimate reason for the decline and fall?
Financial writers are plagued by the same lack of agreement as to what causes markets to collapse. The reasons they offer range from the prosaic to the profound. Most commonly they assume that a market collapse is the result of asset prices being "too high" or unsustainably expensive relative to valuation. What many don't realize is that demand for any given asset can extend well beyond the boundaries of normal valuation for years, or even decades, at a time. We need look no further than the Treasury bond market to see an example of this.
It has become fashionable among collapse historians to assume that collapse often occurs without warning out of a clear blue sky as it were. Nothing could be further from the truth. Collapses are invariably preceded by long periods of internal weakness, whether it's the financial market or any other social system. This explains why strong societies, much like strong markets, can withstand any number of external shocks without toppling. It's only when weakness is entrenched that one can expect external pressure to cause serious damage to a structure.
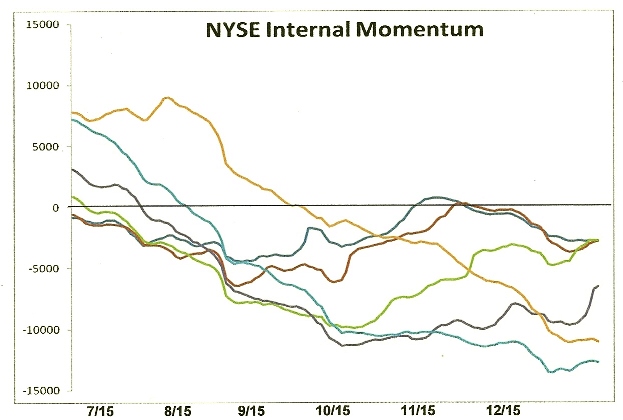
An example of this is the stock market plunge of late 2015/early 2016. In the months leading up to it there was a sustained period of internal weakness and technical erosion in the NYSE broad market. The number of stocks making new 52-week lows was well over 40, and often in the triple digits, which was a clear sign of distribution taking place in some key industry groups. This weakness was evident in the NYSE Hi-Lo Momentum (HILMO) indicators, which depicted a downward path of least resistance for stocks. The following graph is a snapshot of what the HILMO indicators looked like in the weeks just prior to the January 2016 market plunge.

This is also what stock market internal momentum looked like prior to the 2008 credit crash. In fact, it's what precedes every major collapse and it's also a good representation of the internal weakness which takes place before markets, societies and empires collapse. Look below the surface and you'll always see the internal decay which paves the way for the coming destruction. A healthy and thriving system, by contrast, is simply not conducive for a collapse to occur.
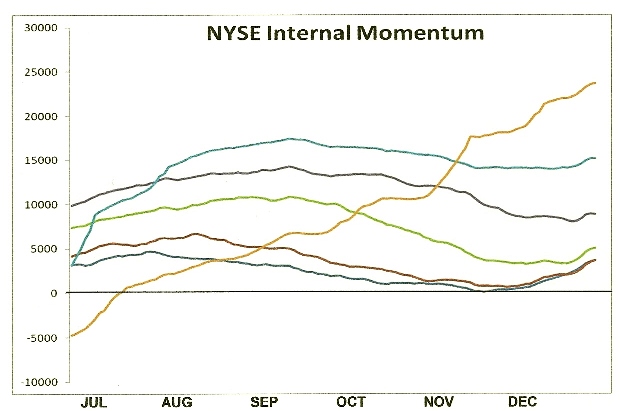
When we view the internal structure of the current NYSE stock market through the lens of the HILMO indicator, what do we see? A market ripe for collapse? Far from it, we see overall signs of technical health – even if the market isn't firing on all cylinders. Below are all six major components of HILMO. The orange line is the longer-term momentum indicator, which is one of the most important one for discerning whether or not the market has been undergoing major distribution (i.e. internal selling). It has been rising for several months now and is the polar opposite of what it looked like heading into 2016.

It would appear then that a collapse isn't on the menu right now, at least not in the intermediate term outlook. If it happens at all it will require a significant reversal of the market's longer-term internal momentum currents, which in turn would likely take several months. The weight of evidence suggests that the doom-and-gloomers who are predicting collapse are much too early and should save their apocalyptic warnings for a more propitious time.
Mastering Moving Averages
The moving average is one of the most versatile of all trading tools and should be a part of every investor's arsenal. Far more than a simple trend line, it's also a dynamic momentum indicator as well as a means of identifying support and resistance across variable time frames. It can also be used in place of an overbought/oversold oscillator when used in relationship to the price of the stock or ETF you're trading in.
In my latest book, Mastering Moving Averages, I remove the mystique behind stock and ETF trading and reveal a simple and reliable system that allows retail traders to profit from both up and down moves in the market. The trading techniques discussed in the book have been carefully calibrated to match today's fast-moving and sometimes volatile market environment. If you're interested in moving average trading techniques, you'll want to read this book.
Order today and receive an autographed copy along with a copy of the book, The Best Strategies for Momentum Traders. Your order also includes a FREE 1-month trial subscription to the Momentum Strategies Report newsletter: http://www.clifdroke.com/books/masteringma.html
By Clif Droke
www.clifdroke.com
Clif Droke is the editor of the daily Gold & Silver Stock Report. Published daily since 2002, the report provides forecasts and analysis of the leading gold, silver, uranium and energy stocks from a short-term technical standpoint. He is also the author of numerous books, including 'How to Read Chart Patterns for Greater Profits.' For more information visit www.clifdroke.com
Clif Droke Archive |
© 2005-2022 http://www.MarketOracle.co.uk - The Market Oracle is a FREE Daily Financial Markets Analysis & Forecasting online publication.


