Stock Market Top?, Sucker’s Play
Stock-Markets / Stock Markets 2016 Dec 12, 2016 - 05:22 PM GMTBy: Brad_Gudgeon
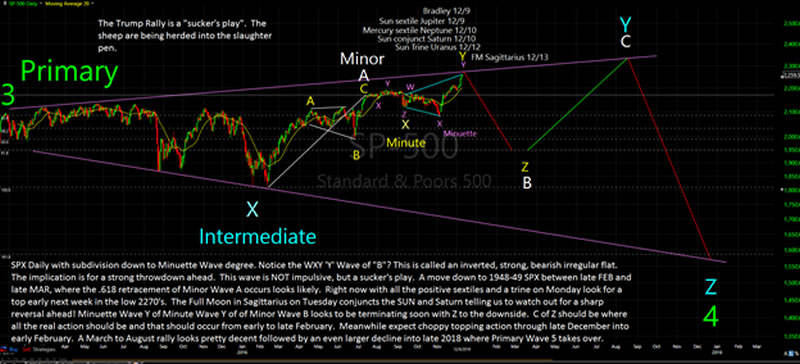
The current rally from November 4 to December 12 (if indeed it was the top) was Minuette Wave Y of Minute Y. Minute Wave Y (of Minor Wave B) was a wxy inverted, irregular and strong bearish flat. Elliott called these B waves or irregular tops. The Trump rally is basically a "sucker's play". The internals of this rally are sick and very selective; the McClellan Summation Index is miles away from confirming it; the Dow Jones Industrials has far exceeded the SPX, which has far exceeded the NASDAQ creating a case of an inter-market bearish divergence. We also have a huge On-Balance-Volume divergence.
A move down into the mid 1900's SPX by February/March 2017 (as noted on the chart below) is my expectation. This would fit a Minor Wave B .618 retracement of Minor Wave A (January 19-July 14) fairly matching the November 2015 – January 2016 drop (due to the raising of rates).
I expect a down-up-down year for 2017, which should end Primary Wave 4. If Primary Wave 4 ends in late 2017 (like I'm thinking), then, the final top should occur somewhere around early 2019. The shallow decline of early November (which should have seen a deep 40 week low) followed by the strong Trump Rally, probably created a fortunate, unexpected delay in the finality of this upcoming, final fifth wave.
Millennial Wave (III?) "since c.a. 1000 C.E." Topping, early 2019?
Grand Super Cycle Wave (V) "since c.a. 1776"; Topping, early 2019?
Super Cycle Wave V "since 1942", Topping, early 2019?
Cycle Wave 5 "since March 2009", Topping, early 2019?
Primary Wave 4 "since late 2014", Rolling over into late 2017?
Intermediate Wave Y "since February 11, 2016", Topping August 2017?
Minor Wave B "since July 14, 2016", Rolling over into March 2017?
Minute Wave Y "since September 12, 2016", Topped December 12, 2016?
Minuette Wave Y "since November 4, 2016", Topped December 12, 2016?
S&P500 Daily Chart

It doesn't matter who is in power, the crash is coming! The above charts are perfect Elliott Wave counts. Are you ready?
Mention on which website you found this article, and you can sign up for any of our newsletters for 50% off the regular price. Contact us as we’ll send you a special e-invoice. Good until December 17, 2016.
Brad Gudgeon
Editor of The BluStar Market Timer
The BluStar Market Timer was rated #1 in the world by Timer Trac in 2014, competing with over 1600 market timers. This occurred despite what the author considered a very difficult year for him. Brad Gudgeon, editor and author of the BluStar Market Timer, is a market veteran of over 30 years. The website is www.blustarmarkettimer.info To view the details more clearly, you may visit our free chart look at www.blustarcharts.weebly.com.
Copyright 2016, BluStar Market Timer. All rights reserved.
Disclaimer: The above information is not intended as investment advice. Market timers can and do make mistakes. The above analysis is believed to be reliable, but we cannot be responsible for losses should they occur as a result of using this information. This article is intended for educational purposes only. Past performance is never a guarantee of future performance.
Brad Gudgeon Archive |
© 2005-2022 http://www.MarketOracle.co.uk - The Market Oracle is a FREE Daily Financial Markets Analysis & Forecasting online publication.


