


The Jaws of Life : The Most Hated Stocks Bull Market in History!
Stock-Markets / Stock Markets 2016 Dec 08, 2016 - 03:22 PM GMT

 Tonight I would like to update the INDU we’ve been following which continues the upside move since the night of the US elections. Keep in mind some of these consolidation patterns began to form back in 2015 which had nothing to do with the US elections. It’s the billions upon billions of shares that were traded which produced this breakout move that is now being recognized for what it is. Even at this stage of the breakout move, there will be many doubters who will never recognize what is actually taking place. It can be very difficult to think outside of the box when we are bombarded everyday on how bad things are and how bad things are going to get. There has to be the proverbial wall of worry in order to have a bull market. Once the bull market becomes mature then the wall of worry comes down, and everyone is invited to invest in the markets, which will be at the blow off phase like in 2000.
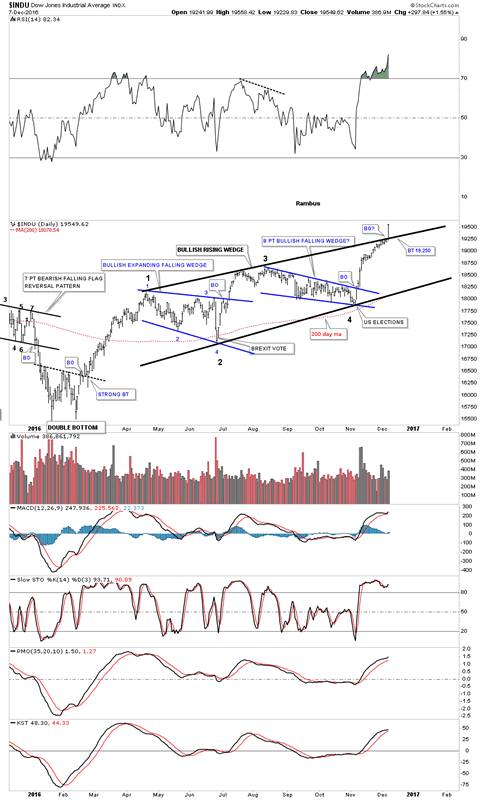
I would like to start by looking at a daily chart for the INDU which I first showed you back in early November of this year, which was consolidating in an eight point bullish falling wedge. Just before that bullish falling wedge the INDU built out another small consolidation pattern which was a bullish expanding falling wedge. Note the breakout from the bullish expanding falling wedge which failed to rally very strongly before the INDU began to correct, and formed the eight point bullish falling wedge. Whenever you see a nice tight consolidation pattern fail to reach its price objective it tells you one of two things. First, the original pattern may be morphing into a bigger pattern. The other possible scenario is a second small well defined consolidation pattern that forms on top of the lower one, which can produce a rising wedge which is the case for the INDU.
The last time I posted this chart I suggested most would see this rising wedge as a bearish rising wedge, and the INDU would collapse into a bear market. Through the years I’ve shown you countless rising wedges that broke to the upside, which always suggest the move is very strong. A consolidation pattern that is slopping up in the same direction of the uptrend instead of against the trend, would be your typical bull flag. Today the INDU finally broke out of the bullish rising wedge with a nice long bar. If we get a backtest to the top rail it would come in around the 19,250 area. One last note on this daily chart, which shows reversal points #2 and #4, on the bottom rail of the black bullish rising wedge, were the BREXIT and US Elections Shocker. Now ain’t that something !
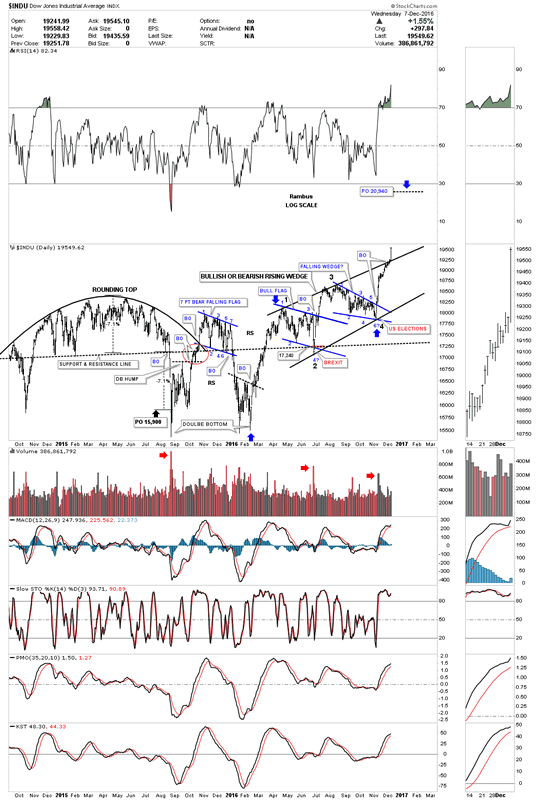
I’m going to work backwards in time so you can see how this small bullish rising wedge fits into the big picture which is most important to understand from the intermediate to long term perspective. Below is a two year chart for the INDU which shows all the trading patterns which led to today’s breakout move.
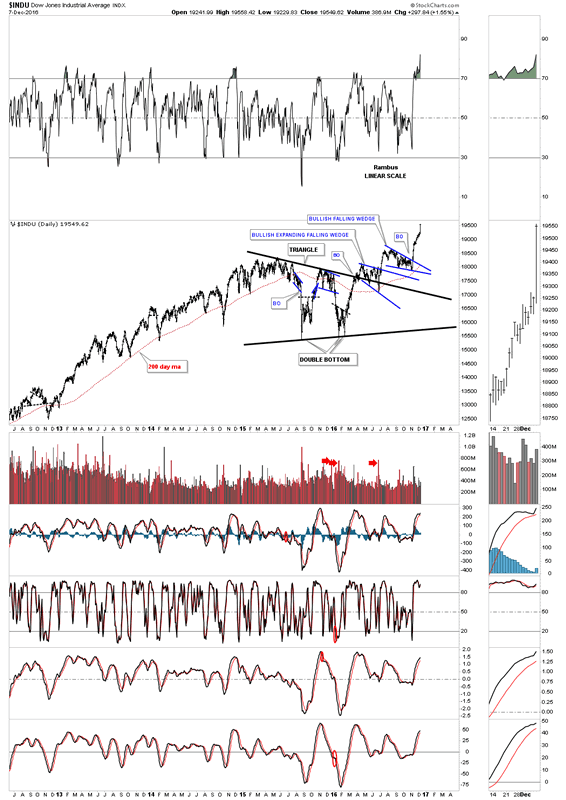
This next chart for the INDU is a five year look which starts to paint the bigger picture. From the middle of 2015 to the middle of 2016 the INDU built out a nice big triangle consolidation pattern. The breakout and backtest to the top rail was the bullish expanding falling wedge we looked at on the first chart above, with the bullish falling wedge just above it. This is what an impulse move looks like starting at the January 2016 low.
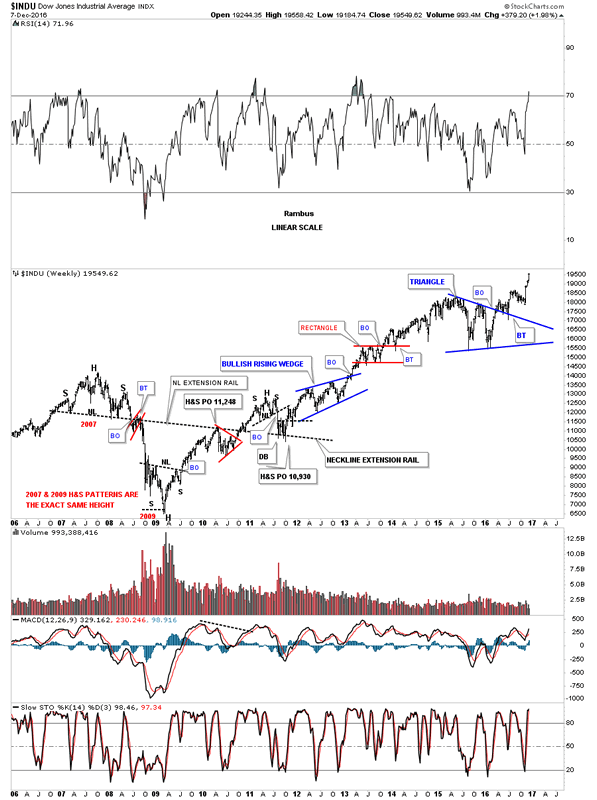
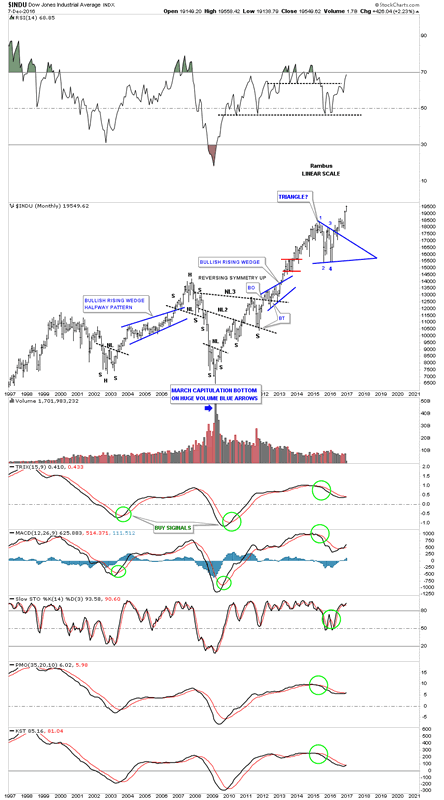
This next chart is a long term weekly look which shows the H&S top that formed back in 2007 before the crash, and then the 2009 inverse H&S bottom which started the most hated bull market in history. Note how the current blue triangle consolidation pattern is starting to stick out like a sore thumb. The markets do one of three things. First, they are building out a reversal pattern, secondly a consolidation pattern, and thirdly they are in an impulse move between a reversal pattern or between consolidation patterns.
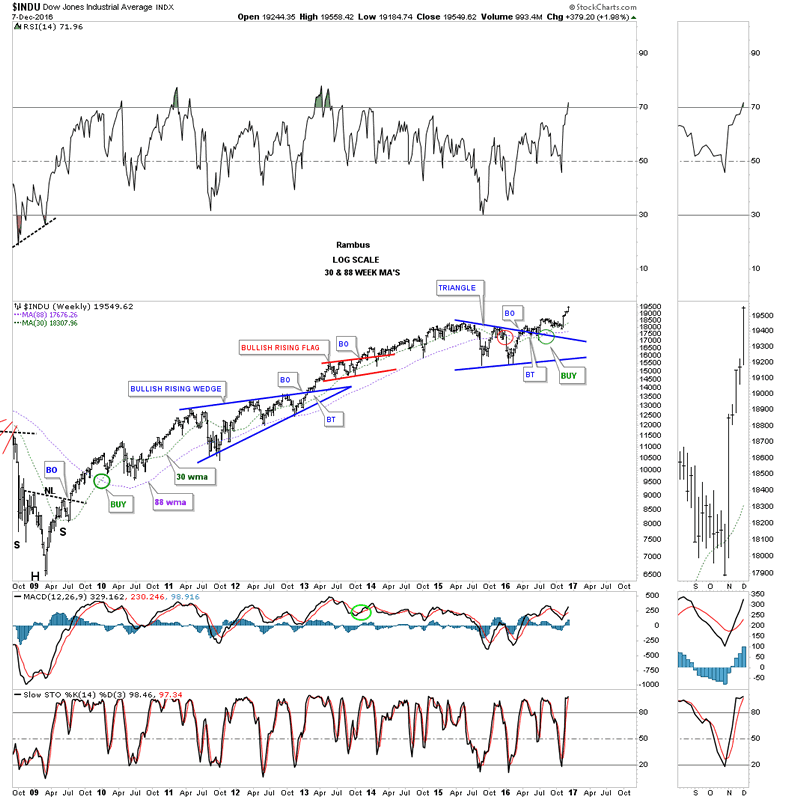
Below is a shorter term weekly chart which shows a simple trend following technique using just the 30 and 88 week moving averages. During the formation of our recent one year triangle consolidation pattern we did get a negative crossover, but that was negated when the 30 crossed back above the 88 week ma. Keep in mind I’m trying to trade the intermediate to the longer term horizon, which is where I feel most comfortable. Once the moving averages become properly aligned there is little to do but follow the price action. As you can see a buy signal was given way back in late 2009 and we didn’t get a sell signal until late 2015. There were several tricky areas when the price action traded below the moving averages for a short period of time but they never crossed to give a sell signal.
Here is a twenty year look at the monthly chart for the INDU which shows you the most hated bull markets in history. From a Chartology perspective it has to be one of the prettiest bull markets which is now rivaling the great bull market in gold from 2000 to 2011.
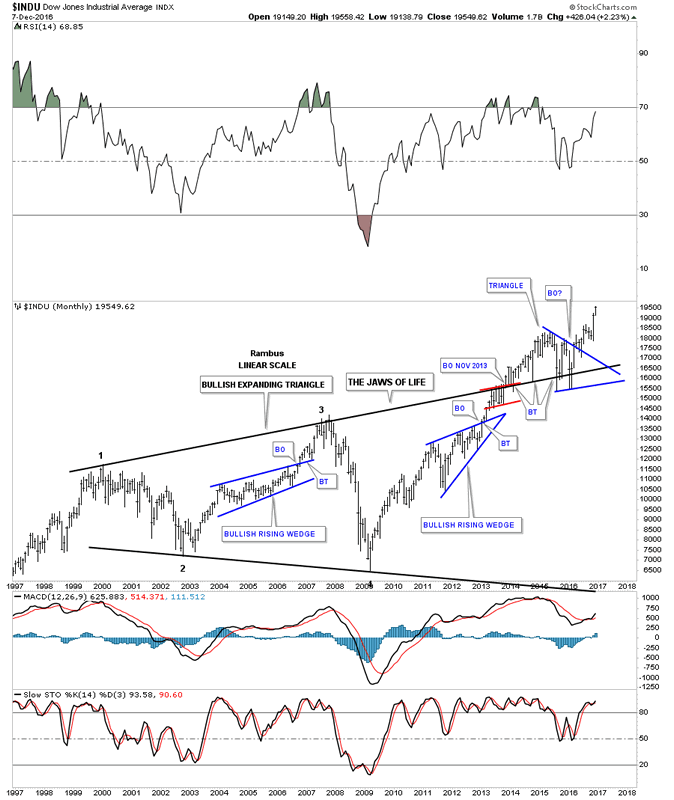
This next twenty year chart for the INDU is where I have for a long while disagreed with just about everyone else. I’ve been showing this 13 year black expanding triangle, JAWS of LIFE, for several years now waiting patiently for all the work to be completed between the breaking out and backtesting phase. I can honestly say I finally feel vindicated after all these years watching this pattern which was being called the “Jaws of Death” develop and waiting for the INDU to make new all time highs above the blue triangle that formed as the backtest. Remember big patterns equals big moves.
This next chart for the INDU is a 75 year quarterly look which I don’t expect anyone in there right mind to believe except those that have their mind open. With that said the INDU is embarking on a multi year secular bull market that began in 2009. Note the beautiful H&S consolidation pattern that formed in the late 1960’s and 1970’s that finally broke out in 1982, with one last backtest to the neckline, which began the greatest bull market of all time. Now you can see how the Jaws of Life pattern fits into the very big picture. The 2009 crash low actually started our current secular bull market that will run for many years to come. It won’t come without any corrections, but the big trend is up after a nearly ten year consolidation pattern, Jaws of Life. Note how the top rail of the Jaws of Life has held support as the backtest and now the INDU is making new all time highs almost on a daily basis now.
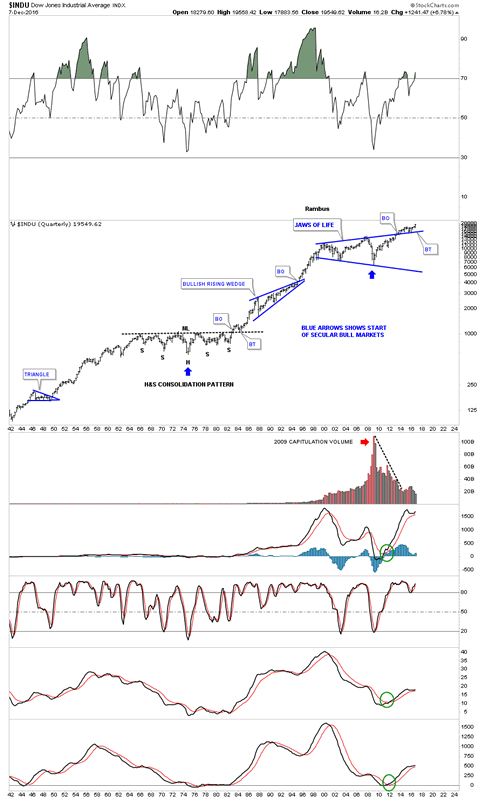
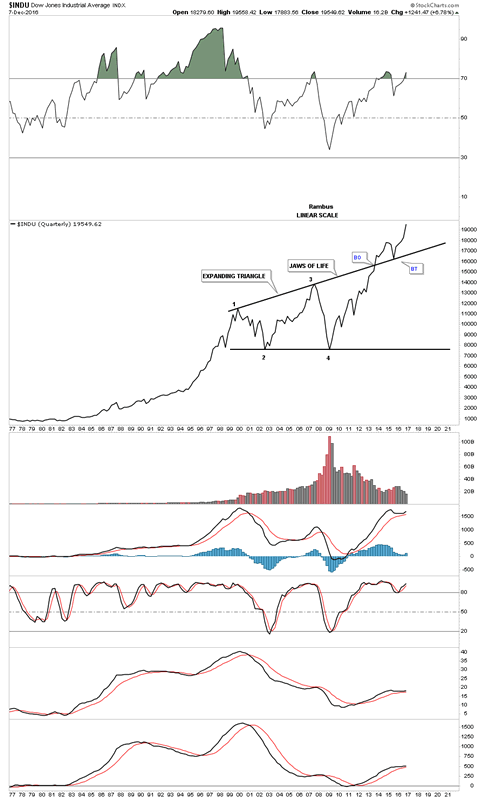
This last chart for the INDU is a quarterly line chart which really brings things home, IMHO. As you can see there are four reversal points made within the Jaws of Life consolidation pattern. There was a nice clean breakout with an equally clean backtest to the top rail. I can guarantee you that you will not see the INDU presented in this fashion anywhere else on the planet. I have many more charts, in different areas of the markets that I’ll post in the Weekend Report that will give credence that the Jaws of Life is in fact the real deal, and the secular bull market that started in 2009 has a long time to run albeit, with some corrections along the way.
I know how hard it is for most folks to even imagine that the stock markets are in a secular bull market, but just think back to the bottom in 2009. Could you have imagined the INDU would be pushing 20,000 in 2016? If the markets have taught me one thing through the years, that would be to keep an open mind above everything else
All the best
Gary (for Rambus Chartology)
FREE TRIAL - http://rambus1.com/?page_id=10
© 2016 Copyright Rambus- All Rights Reserved
Disclaimer: The above is a matter of opinion provided for general information purposes only and is not intended as investment advice. Information and analysis above are derived from sources and utilising methods believed to be reliable, but we cannot accept responsibility for any losses you may incur as a result of this analysis. Individuals should consult with their personal financial advisors.
© 2005-2022 http://www.MarketOracle.co.uk - The Market Oracle is a FREE Daily Financial Markets Analysis & Forecasting online publication.