Trump Likely to Drive Another Bump in Stock Market Buybacks — Here’s How to Hedge
Stock-Markets / Stock Markets 2016 Dec 07, 2016 - 04:06 PM GMTBy: John_Mauldin
 With the bull market in US stocks approaching its seventh anniversay in March 2017 and the indexes just hitting all-time highs, many investors are wondering how long the party can continue.
The chart below shows how the Dow Jones, Russell 2000, NASDAQ, and S&P 500 have all soared to record highs.
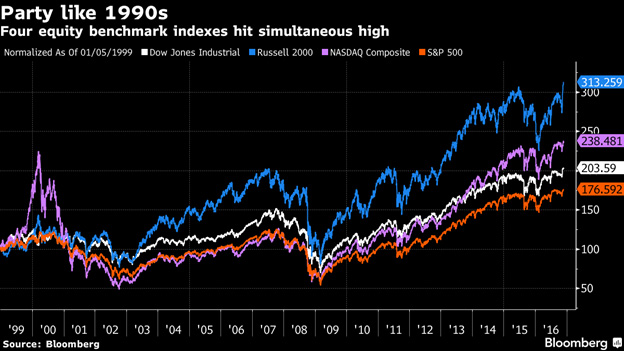
Only time will tell how long this trend will last, but we do know that eventually, there’s always a downturn. Looking at several key metrics can bring clarity to the overall health and sustainability of the rally and reveal what investors can do now to prepare for a slumping stock market in the future.
Failed stimulus
In the aftermath of the 2008–2009 financial crisis, the Federal Reserve embarked on extraordinary measures to stabalize the financial system and revive asset prices. They bailed out financial institutions, slashed interest rates, and set in motion massive amounts of quantitative easing.
This proved to have a quick and relativlely long-lasting effect on the stock market and eventually translated into the booming real estate markets as well. However, the stimulus didn’t do what it was intended to do: rekindle business and economic growth.
The credit produced through QE has mostly flowed to Federal Reserve member bank balance sheets where it’s earning 0.5% interest from the Fed annually.
Last year, the Fed paid approximately $7 billion in interest to member banks on excess reserces, including $100 million to Goldman Sachs and more than $900 million to JPMorgan Chase. But I digress, as this is a topic we’ll cover in a separate post.
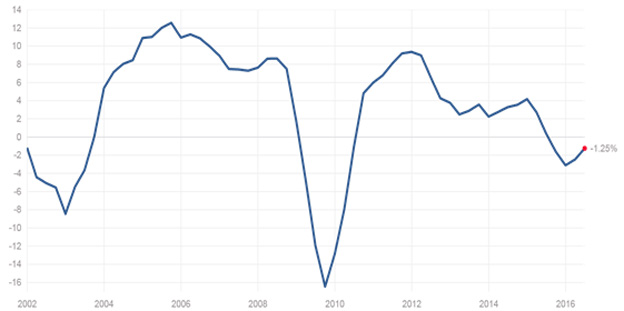
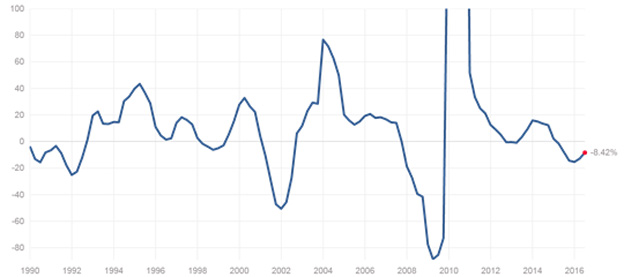
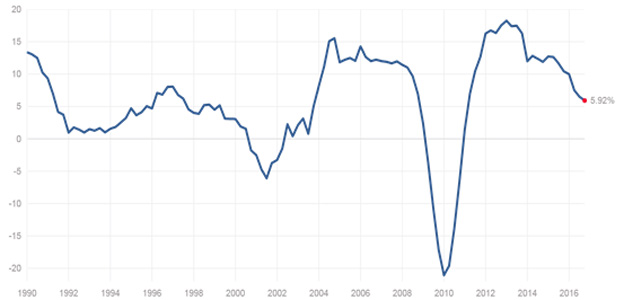
Taking a closer look at the fundamenatal drivers of stock prices, revenue, and earnings reveals a market looking more suspectible to a correction than a continued rally.
Annual sales, earnings, and the dividend growth rates for the S&P 500 declined through the second quarter of 2016. The figure near the red dot is the most recent annual change.
S&P 500 Sales Growth Rate
Source: Standard and Poor’s
S&P 500 Earnings Growth Rate
Source: Standard and Poor’s
S&P 500 Dividend Growth Rate
Source: Standard and Poor’s
Changing the math
In Q3 2016, S&P 500 revenues grew by 2.5% YOY, ending a string of six straight quarterly declines. However, earnings per share managed to increase 4.3%. As companies have struggled with top-line growth since the financial crisis, they have employed another measure to appease Wall Street analysts and investors.
Companines have been issuing debt to buy back shares, raising earnings per share in the process. For example, Apple’s debt has grown from $17 billion in 2013 to over $75 billion in 2016. At the same time, shares outstanding have been reduced from 6.6 billion to 5.3 billion—a 20% reduction—and boosting earnings per share in the process. If Apple had the same number of shares outstanding in the current fiscal year as it did in 2015, its earnings per share would have been 5.1% lower. Given Apple’s 2016 revenue of $215 billion, this is not an insignificant figure.
On a broader level, payouts to shareholders of S&P 500 companies—via buybacks and dividends—have increased 20% annually since 2009 as the rate of buybacks have soared. Shareholder payouts through dividend and buybacks have been increassing faster than earnings since 2014—not an encouraging signal.
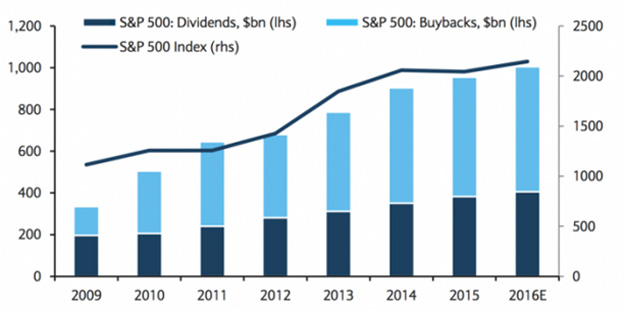
Source: S&P, Haver, Barclays Research
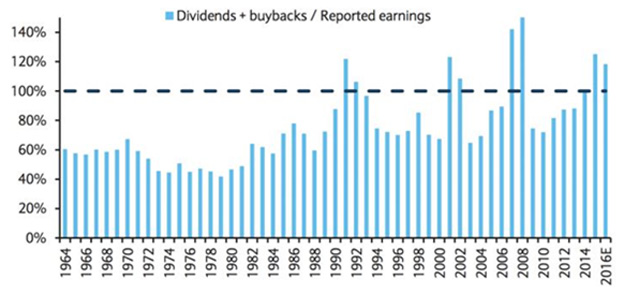
Source: S&P, Haver, Barclays Research
Buybacks now account for 26% use of corporate cash—up from 13% in 2009—and forecast to be 30% in 2017, an 11% annual growth rate.
Trump likely to drive another bump in buybacks
S&P 500 companies are expected to buy back even more shares next year, as the new presidential administration looks set to encourage them to repatriate overseas cash back to the United States.
Share repurchases may climb 30% in 2017 to $780 billion, per estimates from Goldman Sachs, with $150 billion (or about 20% of the buybacks) coming from repatriation of overseas cash.
If its forecasts play out, buybacks will make up the largest use of cash among S&P 500 companies for only the second time in the last two decades.
As seen below, investors’ preference for buybacks vs. dividend paying shares underlies the rally in the stocks this year, and has become even more pronounced since the election.
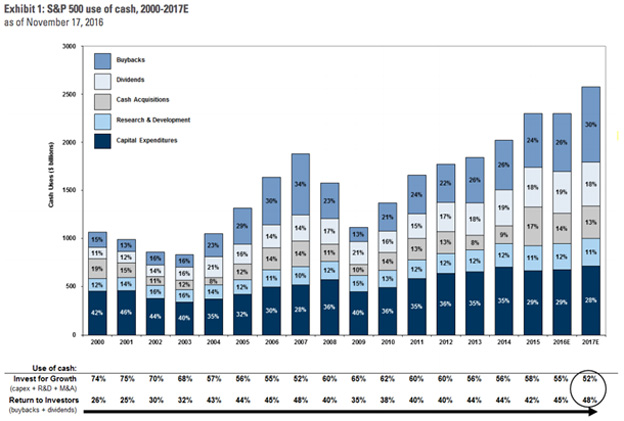
Source: Compustat, Goldman Sachs Global Investment research
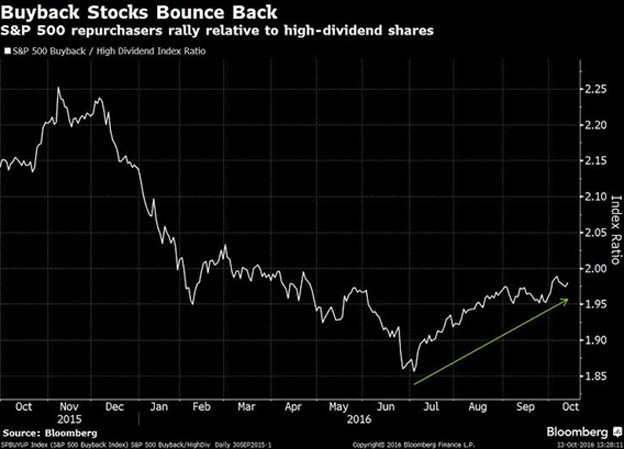
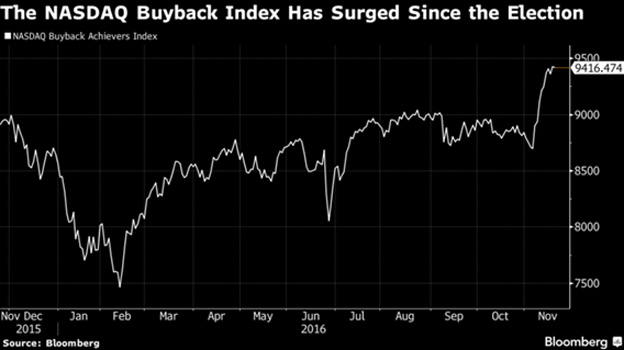
With the Trump administration taking the reins in January and Republicans having a majority in Washington, we’ll find out relatively soon if newly enacted policies translate into economic and corporate growth.
If changes don’t materialize, investors may be disappointed as the current rally fades into 2017.
Preparing for uncertainty
With increased central bank interventions and the severity of market corrections in recent decades, having a well-diversified portfolio is more important than ever. As we know, market timing is generally a futile exercise; it doesn’t care when you plan to retire, buy a house, start a business, or embark on life’s milestones.
Holding a percentage of assets uncorrelated to the stock market is one the best hedges against risk and a sound tool for capital preservation. Investors looking to be prepared for anything in the coming years would do well to add a hard asset like physical bullion to their portfolios.
Gold is considered one of the world’s best safe haven assets because of its ability to increase overall portfolio performance and decrease volatility. And it may be the smartest way to prepare for an impending slump in the stock market.
To see an example of gold’s potential, look at this chart showing the performance of eight major global stocks markets since 2000.
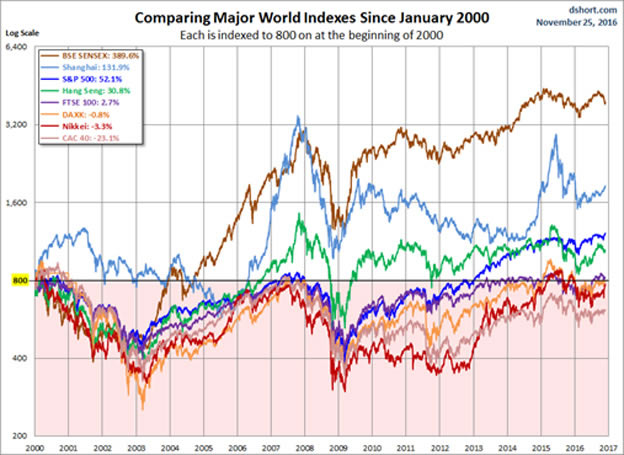
An investor holding a proxy for S&P 500 stocks during this time would have earned 2.6% annually—and lost money if fully invested in the major European markets or Japan.
If the start date was moved forward a few years to 2002, the return of the S&P 500 would look much different, but it’s an important exercise nonetheless because it underscores the benefit of uncorrelated assets like gold.
Whatever happens when Trump takes the reins in January, investors who own a meaningful amount of gold will be well positioned to weather increased market turbulence.
Free Ebook: Investing in Precious Metals 101: How to buy and store physical gold and silver
Download Investing in Precious Metals 101 for everything you need to know before buying gold and silver. Learn how to make asset correlation work for you, how to buy metal (plus how much you need), and which type of gold makes for the safest investment. You’ll also get tips for finding a dealer you can trust and discover what professional storage offers that the banking system can’t. It’s the definitive guide for investors new to the precious metals market. Get it now.
John Mauldin Archive |
© 2005-2022 http://www.MarketOracle.co.uk - The Market Oracle is a FREE Daily Financial Markets Analysis & Forecasting online publication.


