


Crude Oil Prices: "Random"? Hardly
Commodities / Crude Oil Dec 05, 2016 - 06:33 PM GMTBy: EWI

 The more emotional the market, the more predictable it is.
Last week's shocking spike in crude oil prices is +12% and counting, the biggest one-week gain in five years. Media stories blame one culprit: the November 30 OPEC agreement to cut production.
In absolute terms, the agreed-to cut is small: 1.2 million barrels a day, less than 2% of daily global oil production. Given the existing supply glut, that's a drop in the bucket (no pun intended). Yet, it was a bigger cut than the market expected; plus, the fact that OPEC members came to an agreement at all was enough to play a role in soaring prices.
The weeks leading up to the meeting were filled with anticipation and emotion. Oil prices went all over the place -- down 4% one day, 3% the next. Yet, those fluctuations weren't random.
The more emotional the markets get, the more influential the collective psychology of the market players becomes. That's why Elliott wave price patterns often get particularly clear when volatility strikes.
See for yourself. Below are excerpts from the forecasts our Energy Pro Service, edited by the veteran oil market analyst Steve Craig, posted for subscribers starting in mid-November.
November 15
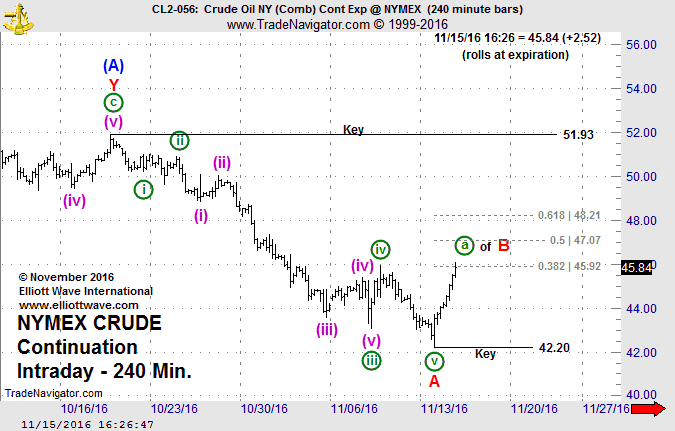
-- Today's pop above 45.95 leads me to believe that wave A ended at Monday's 42.20 sell-off low. Trade below 45.28 would offer an aggressive hint that wave ((a)) is complete and I'll be looking for downside follow through...
November 18
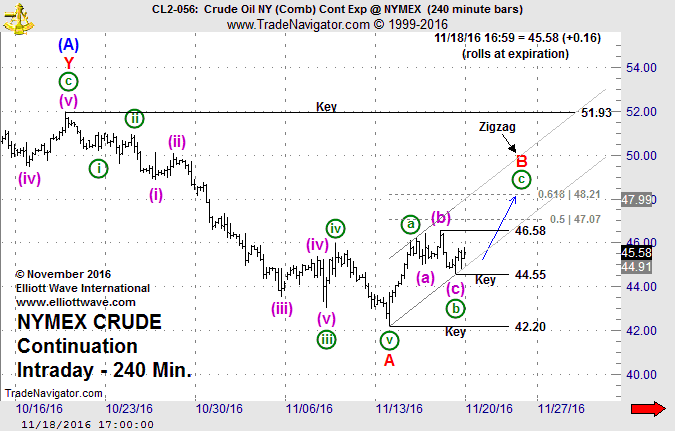
-- Crude extended its slide from Thursday's 46.58 rebound high down to 44.55 and is attempting to reverse. ...trade above 46.58 should be a good sign that it marks an interim bottom and that the next leg of the advance is underway.
November 22
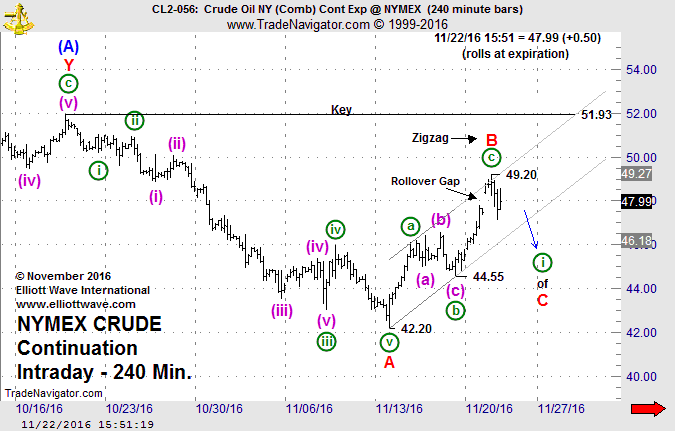
-- Searching for a top (49.20?). Crude extended its advance up to 49.20. The price action gives wave ((c)) enough legs to count it and the countertrend advance as complete.
November 25
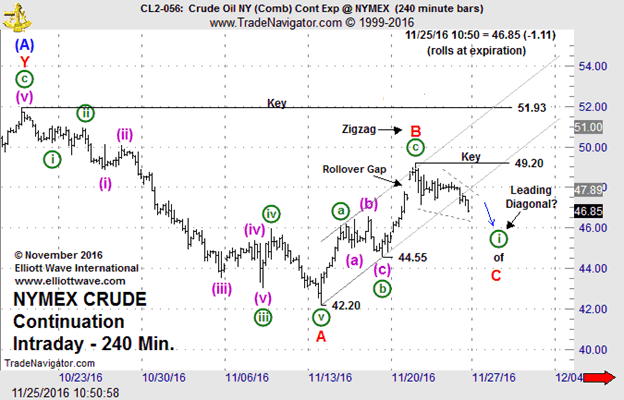
-- A bearish stance seems warranted. Crude remains under selling pressure... The next big hurdle to cross is January's 45.18 wave ((b)) low. Ideally, resistance at 48.26 will hold.
November 28
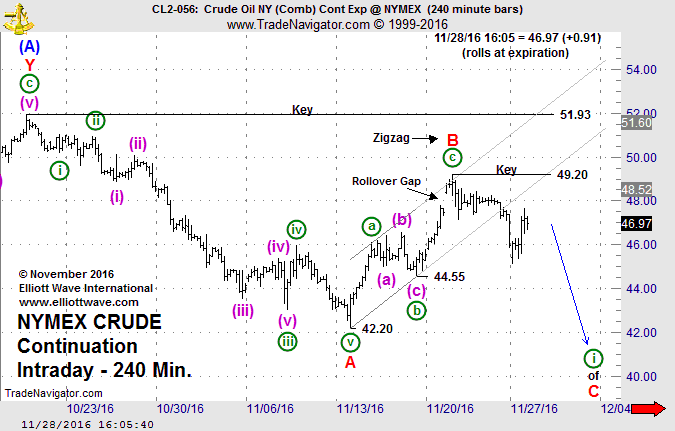
-- Bearish against 49.20. WTI extended its decline to 45.14 ... if wave B has ended, the rally from 45.14 will prove corrective and set the stage for further decline.
The next day, November 29, oil prices indeed fell...
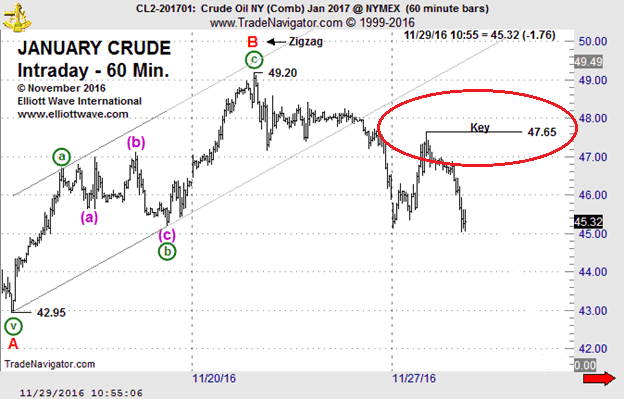
...and the day after, OPEC agreed to cut production. Oil prices soared, taking out the key resistance level at $47.65 you see circled in red in the chart above -- and, for the first time in weeks, negating our forecast.
This brief history shows that, while crude oil price gyrations may seem random and unpredictable, they are anything but.
It also shows you that even when an Elliott wave forecast doesn't work out, you almost always have a "line in the sand" which, if breached, tells you it's time to get out (e.g., $47.65 in the chart above).
And here's another interesting piece of information. Says CNBC:
"Since 1998, OPEC has cut production 15 times.
"A week later, U.S. crude rose 60 percent of the time...
"...But a month after cuts, U.S. crude was down 53 percent of the time."
We'll see in a few weeks if the second part of this pattern plays out.
Learn to Apply the Wave Principle to Your MarketsThe Elliott Wave Basic Tutorial gives you the foundation you need to start using the Wave Principle to improve your trading and investing. You'll learn:
|
This article was syndicated by Elliott Wave International and was originally published under the headline Crude Oil Prices: "Random"? Hardly.. EWI is the world's largest market forecasting firm. Its staff of full-time analysts led by Chartered Market Technician Robert Prechter provides 24-hour-a-day market analysis to institutional and private investors around the world.
About the Publisher, Elliott Wave International
Founded in 1979 by Robert R. Prechter Jr., Elliott Wave International (EWI) is the world's largest market forecasting firm. Its staff of full-time analysts provides 24-hour-a-day market analysis to institutional and private investors around the world.
© 2005-2022 http://www.MarketOracle.co.uk - The Market Oracle is a FREE Daily Financial Markets Analysis & Forecasting online publication.