How To Determine The Future Price Of Silver?
Commodities / Gold and Silver 2016 Nov 17, 2016 - 02:45 AM GMTBy: InvestingHaven
 We very often get the question from readers how to read charts, and how to determine the future price of an asset or stock. Given the interest of many investors in precious metals, and lots of reactions we received on our future price of gold 2017 article, we explain in this article how we determine the future price of silver. Readers who are not interested in this chart analysis tutorial can consult our silver price forecast 2017 for our expected future silver price in 2017.
Silver chart analysis
We are aware of the stream of thoughts that charts are worthless, especially when it comes to precious metals, because the “metals are manipulated”. While that could be correct, and we tend to believe that price setting is influenced by large futures traders, the viewpoint is not useful. The point is that the only way to look at an asset is to analyze price behavior. Moreover, charts ‘include’ manipulative market behavior.
Charts have many variables including time interval, dimensions, aspect ratios, and many more. It is important to look at several time frames in order to understand short, medium and long term dynamics. In other words, investors should look for short and long term patterns.
Moreover, the cleaner the chart, the simpler the challenge to identify patterns.
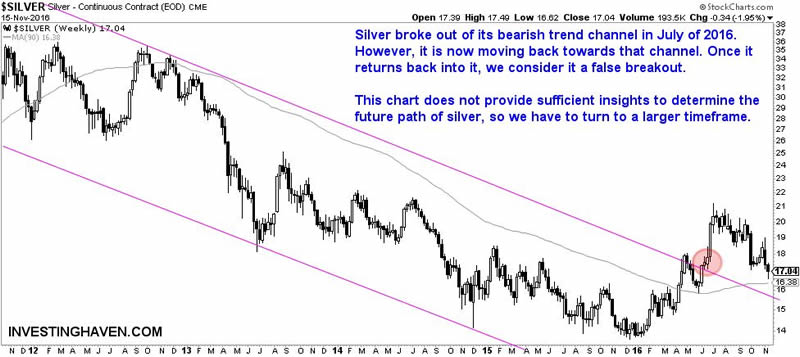
With that, we turn to a weekly chart on 5 years. This chart shows a down trend in a clear channel. In July of 2016, silver broke out of this downtrend, a very bullish event. However, soon after, silver moved back towards that channel. If silver continues to fall, we can say the breakout was false.
This chart does not reveal too much additional insights. That is why we have to look at a longer term chart in order to get additional insights.

The future price of silver
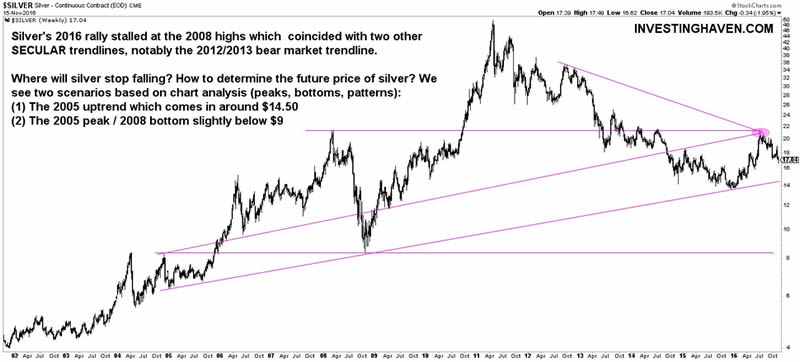
As the 5-year chart does not provide sufficient insights, we turn to a long term silver chart. The key challenge is to identify important trendlines on such a chart, which investors can do by connecting sharp peaks and bottoms. Remember, 90% of prices are worthless, it is only a minority of less than 10% of price points which carry value. It is a matter of discovering patterns with these price points.
We see the importance of $21 as it connects three secular trendlines. So it was a no-brainer that the silver price would get huge resistance at that price point.
Given the direction of silver, which is clearly down, the key question is where will silver stop falling? What is the future price of silver?
We derive the answer to that question based on secular trendlines. One obvious trendline is the one that started in 2004 and connects the important 2009 bottom. It points to $14.50 as a future price of silver. We believe that price will be reached in 2017.
If silver does not stop falling at that point, which does not seem likely in our view, the very bearish scenario is that $9 would be the ultimate future silver price. We derived that price point based on the horizontal trendline right above $8, connecting two important price points.

Are Fibonacci retracements useful in determining the future price of silver?
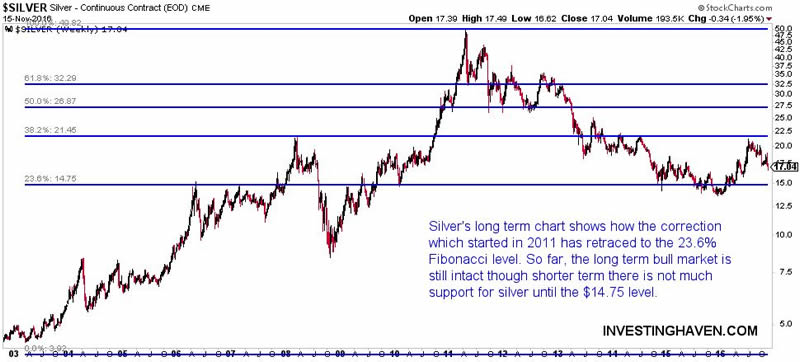
Some analysts look at Fibonacci retracement levels to identiy the future price of silver. We do not believe this should be a primary method of analysis. We tend to believe that is carries some supporting insights, of secondary importance.
The Fibonacci chart of silver’s secular bull market suggests that silver is still in an uptrend as long as it trades above $14.75. However, below that price point, silver would be in a bear market. In all honesty, we do not tend to believe that statement, because, based on the above chart, silver can still fall to $9 and be in a long term secular bull market.

We are bullish silver on the very long term
Though we understand our focus on the charts, and, for some, this could be ‘too much of it’. However, price is the only thing that matters in investing. We could come across as silver bears, but nothing is further from the truth. We are bearish for 2017, but essentially we see a once-in-a-decade opportunity in the gold and silver market, and we must admit that we are preparing our shopping list with gold and silver miners. 2016 was great in the first months, but we believe that, after the ongoing sell off in precious metals, 2017 will be setting up for a long term bottom, and, hence, a great buying opportunity.
Analyst Team
The team has +15 years of experience in global markets. Their methodology is unique and effective, yet easy to understand; it is based on chart analysis combined with intermarket / fundamental / sentiment analysis. The work of the team appeared on major financial outlets like FinancialSense, SeekingAlpha, MarketWatch, ...
Copyright © 2016 Investing Haven - All Rights Reserved Disclaimer: The above is a matter of opinion provided for general information purposes only and is not intended as investment advice. Information and analysis above are derived from sources and utilising methods believed to be reliable, but we cannot accept responsibility for any losses you may incur as a result of this analysis. Individuals should consult with their personal financial advisors.
© 2005-2022 http://www.MarketOracle.co.uk - The Market Oracle is a FREE Daily Financial Markets Analysis & Forecasting online publication.


