


Non-USD Picture of Crude Oil
Commodities / Crude Oil Nov 16, 2016 - 12:17 PM GMTBy: Nadia_Simmons

 Trading position (short-term; our opinion): Long positions (with a stop-loss order at $41.39 and initial upside target at $49.53) are justified from the risk/reward perspective.
Although crude oil moved lower after the markets open, oil bulls stopped further deterioration and triggered a rebound in the following hours. As a result, light crude erased most of earlier losses and closed the day above Friday’s low. What can we expect in the coming days?
Let’s examine the charts below and try to find out (charts courtesy of http://stockcharts.com).
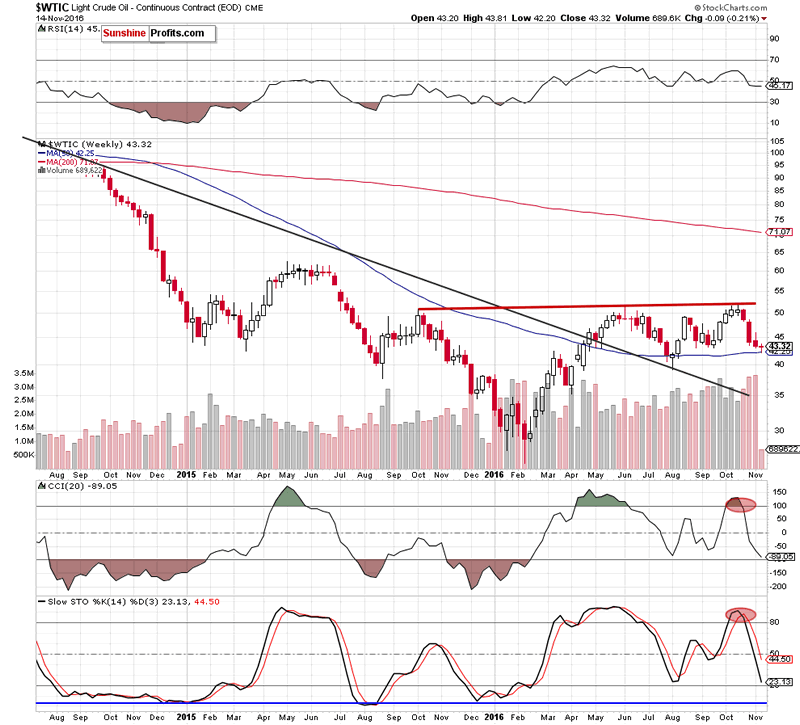
Looking at the weekly chart, we see that although crude oil moved little lower this week, the 50-week moving average continues to keep declines in check.
Are there any other technical factors that could encourage oil bulls to act in the coming days? Let’s examine the day and find out.
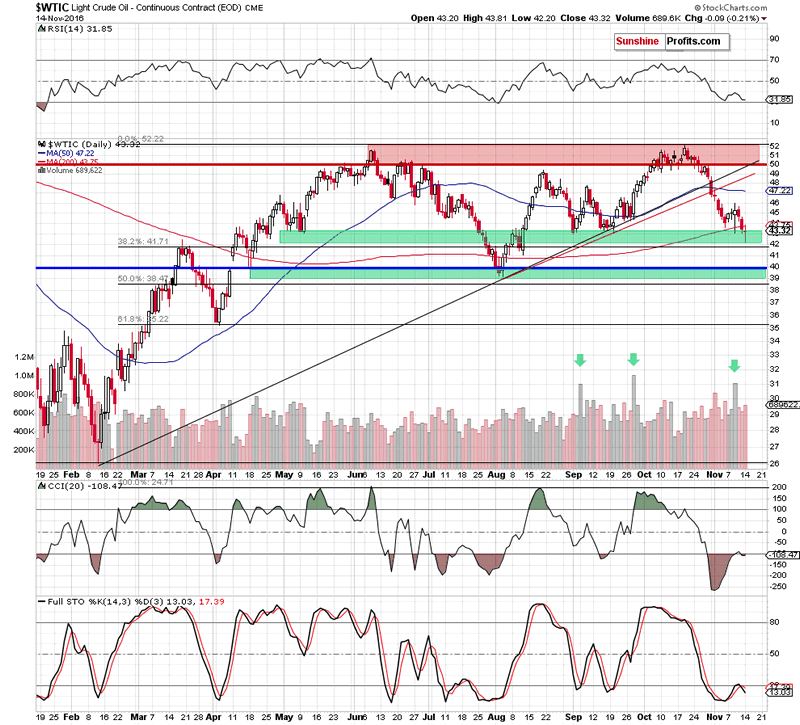
Yesterday, we wrote the following:
(…) Today’s move lower in crude oil below $43 (to about $42.50) could be viewed as a breakdown below the September lows, but we don’t view it as such - at least not yet. The reason is that today’s session is far from being over and the move below $43 was almost invalidated. Depending on the closing price, we could see (…) a reversal and invalidation of the intra-day breakdown, which would be very bullish.
From today’s point of view, we see that the situation developed in line with the above scenario and crude oil rebounded, invalidating the intra-day breakdown below the September lows, which is a bullish signal that suggests further improvement.
Additionally the current situation in the non-USD (WTIC:UDN ratio) chart of crude oil also supports the pro-growth scenario. Why? Let’s take a closer look at the charts below and find out.
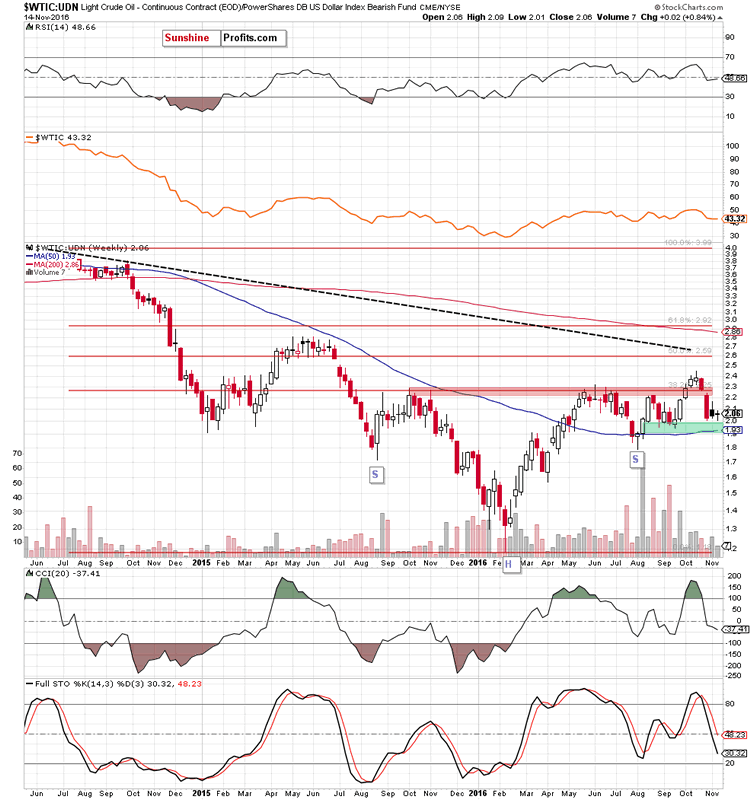
From the weekly perspective, we see that although the ratio moved lower and erased almost all of the last week’ gains, the green support zone (reinforced by the 50-week moving average) continues to keep declines in check, which is a positive signal.
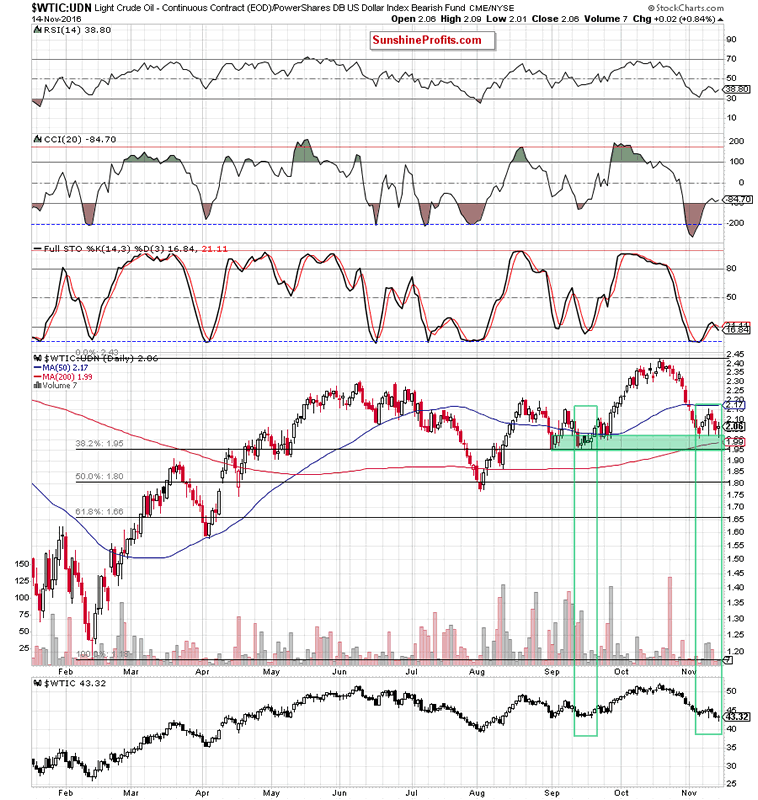
On top of that, the first thing that catches the eye on the daily chart is a positive divergence between the ratio and the price of crude oil. As you see, although the black gold hit a fresh low yesterday, we didn’t see such price action in the case of the ratio, which is a bullish signal that suggests further improvement. Why we think so? When we take a closer look at the above chart, we can notice a similar situation in September (both cases we marked with green rectangles). Back then such event encouraged oil bulls to act, which resulted in a rebound that finally took the ratio (and also crude oil) to fresh 2016 highs. Additionally, a buy signal generated by the CCI remains in place, supporting oil bulls and another attempt to move higher.
Therefore, if we see such price action, the upside targets from our Thursday’s alert would be in play:
(…) If (…) light crude extends gains, we’ll likely see an upward move to (at least) (…) the previously-broken red and black resistance lines (…)
Summing up, crude oil moved higher and invalidated earlier breakdown under the September lows, which in combination with the current situation in the WTIC:UDN ratio suggests that higher prices of the black gold are just around the corner.
Very short-term outlook: bullish
Short-term outlook: bullish
MT outlook: mixed
LT outlook: mixed
Thank you.
Nadia Simmons
Forex & Oil Trading Strategist
Przemyslaw Radomski
Founder, Editor-in-chief
Sunshine Profits: Gold & Silver, Forex, Bitcoin, Crude Oil & Stocks
Stay updated: sign up for our free mailing list today
* * * * *
Disclaimer
All essays, research and information found above represent analyses and opinions of Nadia Simmons and Sunshine Profits' associates only. As such, it may prove wrong and be a subject to change without notice. Opinions and analyses were based on data available to authors of respective essays at the time of writing. Although the information provided above is based on careful research and sources that are believed to be accurate, Nadia Simmons and his associates do not guarantee the accuracy or thoroughness of the data or information reported. The opinions published above are neither an offer nor a recommendation to purchase or sell any securities. Nadia Simmons is not a Registered Securities Advisor. By reading Nadia Simmons’ reports you fully agree that he will not be held responsible or liable for any decisions you make regarding any information provided in these reports. Investing, trading and speculation in any financial markets may involve high risk of loss. Nadia Simmons, Sunshine Profits' employees and affiliates as well as members of their families may have a short or long position in any securities, including those mentioned in any of the reports or essays, and may make additional purchases and/or sales of those securities without notice.
© 2005-2022 http://www.MarketOracle.co.uk - The Market Oracle is a FREE Daily Financial Markets Analysis & Forecasting online publication.