Payrolls and Unemployment Data Confirm US In Recession
Economics / Recession 2008 - 2010 Aug 02, 2008 - 01:15 AM GMTBy: Paul_L_Kasriel
 Civilian Unemployment Rate: 5.7% in July vs. 5.5% in June; cycle low is 4.4% in March 2007
Payroll Employment: -51,000 in July vs. -51,000 in June, net gain of 26,000 jobs after revisions of payroll estimates for May and June.
Hourly earnings: +6 cents to $18.06, 3.4% yoy change vs. 3.4% yoy change in June; cycle high is 4.28% yoy change in Dec. 2006.
HIGHLIGHTS OF THE JULY 2008 EMPLOYMENT REPORT
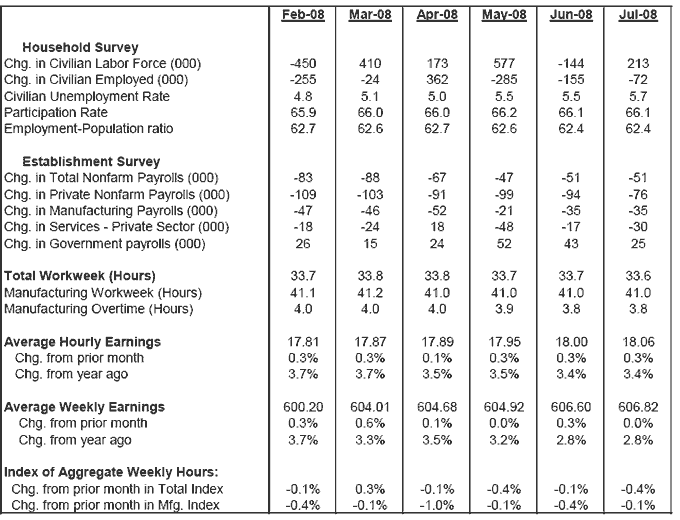
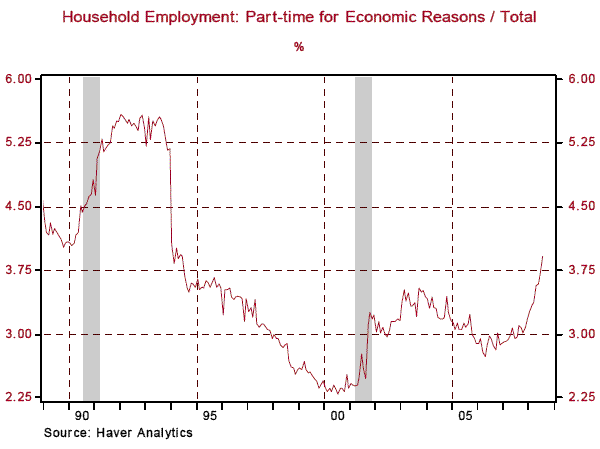
Household Survey - The civilian unemployment rate increased by two "ticks" to 5.7% in July. The cycle low unemployment rate was 4.4% (December 2006 and March 2007). The broadest measure of labor underutilization, which includes the officially unemployed, those employed part-time but desiring full-time employment and those who are willing and able to work but have given up hope of employment, jumped four ticks in July to a level of 10.3% -- the highest level since September 2003 (see Chart 1). Speaking of part-time employment, the percentage of persons employed part-time but seeking full-time employment rose to 3.9% of total household employment in July. As Chart 2 shows, there has been a rapid increase in the ratio in recent months, which is typical as the economy slips into recession.
Chart 1
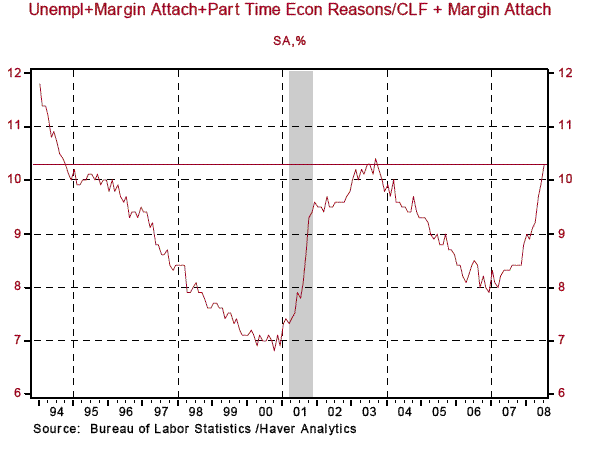
Chart 2
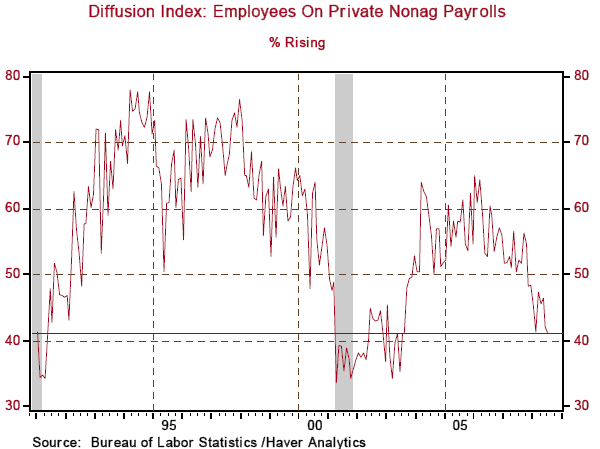
Establishment Survey - Total nonfarm payrolls fell by 51,000 in July - the seventh consecutive monthly decline. Private nonfarm payrolls fell by 76,000 in July. Although revisions to May and June total payrolls netted out to a plus 26,000 jobs, these revisions netted out to a minus 11,000 jobs in the private sector. There were job losses across a wide spectrum of industries as evidenced by the July diffusion index falling a full point to 41.2 - the lowest reading since August 2003 (see Chart 3).
Chart 3
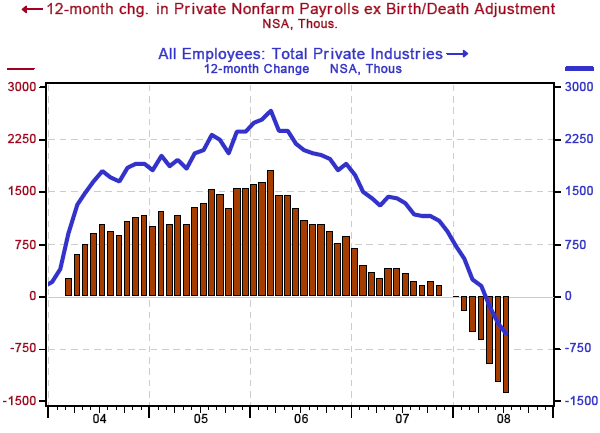
In the past 12 months, private nonfarm payrolls have declined by a net 535,000. In the past 12 months, the so-called birth/death adjustment has added a net 853,000 jobs. If the birth/death adjustment is excluded, private nonfarm payrolls declined by 1,388,000 in the 12 months ended July 2008 (see Chart 4). If the birth/death adjustment is inaccurately biasing upward private nonfarm employment, then all of the other government economic statistics that are derived from nonfarm payrolls also are inaccurately biased upward. Without the birth/death adjustment, perhaps the U.S. economy might not look quite as "resilient" as it allegedly is thought to be by The Wall Street Journal and its op-ed contributors.
Chart 4
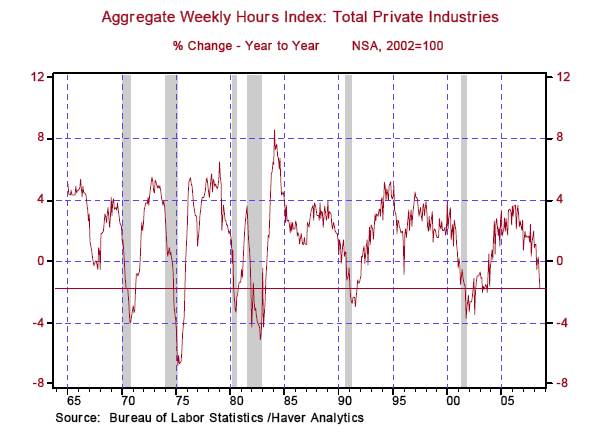
Production is a function of the number of workers, the hours these workers work and the productivity of these workers. The monthly employment report gives us two of these three variables - number of workers and hours worked by them. The combination of these two variables is called the index of aggregate weekly hours of production. In a less politically-correct time, this index was referred to man-hours of production. As shown in Chart 5, this index is down 1.73% in the 12 months ended July. I do not see any other time since the mid 1960s when the year-over-year change in the index of aggregate hours has gone from a positive reading to down minus 1.73% and the economy was not in a recession (the shaded areas in Chart 5). Perhaps things are different this time, but I would bet Ben Stein's money that they are not different.
Chart 5
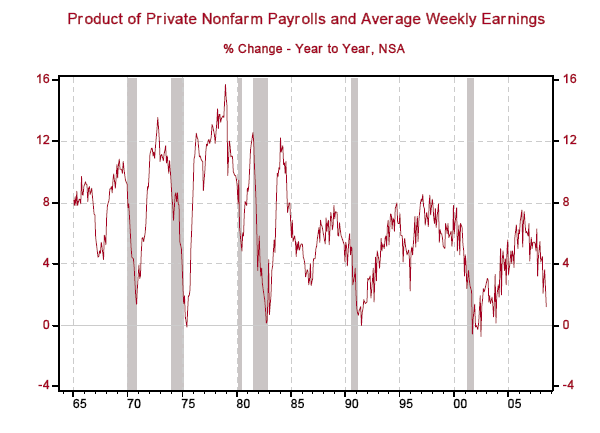
Folks were probably feverishly checking their mailboxes for Treasury rebate checks in July because their paychecks were light. The product of private nonfarm payrolls and average weekly earnings dropped 0.03% in July after increasing 0.22% in June. This augurs for a weak reading in the wage and salary component of the July personal income data. On a year-over-year basis, growth in this proxy for wages and salaries is up 1.18% in July (see Chart 6). What was the year-over-year change in the CPI in June? 5.02%. No wonder retailers are shuttering stores.
Chart 6
Conclusion - After the November elections, the National Bureau of Economic Research will tell us what we and the Fed already know - the U.S. economy currently is in a recession. Industrial commodity prices appear to have peaked, which will begin to moderate the trend in headline U.S. inflation in a couple of months. Businesses have little pricing power at the consumer level. There is no evidence of a wage-price spiral. The inflation-expectations' anchor does not appear to be dragging. The dollar appears to have stabilized, in large part because of economic growth in the rest of the world appears to be slowing significantly. Losses continue to mount on the books of financial institutions, which will inhibit credit creation. Is the Fed going to raise its funds rate target over the remainder of 2008? Not bloody likely!
By Paul L. Kasriel
The Northern Trust Company
Economic Research Department - Daily Global Commentary
Copyright © 2008 Paul Kasriel
Paul joined the economic research unit of The Northern Trust Company in 1986 as Vice President and Economist, being named Senior Vice President and Director of Economic Research in 2000. His economic and interest rate forecasts are used both internally and by clients. The accuracy of the Economic Research Department's forecasts has consistently been highly-ranked in the Blue Chip survey of about 50 forecasters over the years. To that point, Paul received the prestigious 2006 Lawrence R. Klein Award for having the most accurate economic forecast among the Blue Chip survey participants for the years 2002 through 2005.
The opinions expressed herein are those of the author and do not necessarily represent the views of The Northern Trust Company. The Northern Trust Company does not warrant the accuracy or completeness of information contained herein, such information is subject to change and is not intended to influence your investment decisions.
Paul L. Kasriel Archive |
© 2005-2022 http://www.MarketOracle.co.uk - The Market Oracle is a FREE Daily Financial Markets Analysis & Forecasting online publication.


