


Bond Market Bull Over or The Start of The Final Blow Off Top?
Interest-Rates / Bond Bubble Nov 14, 2016 - 05:36 AM GMTBy: Plunger

 Over a Trillion dollars has been vaporized in the bond market in just one week. The phrase "blood bath" is an understatement as the widows and orphans have been routed. This isn't supposed to happen in the the bond market. So is the great 33 year bond bull finally over and the deluge that we knew would ultimately come upon us? Not so fast chipmunk, is my reply and this is why. All great bull markets go through three complete phases. Phase I is the accumulation or stealth phase, phase II is the mark-up phase which lasts the longest and phase III is the blow off or mania phase. The NASDAQ and the oil bull markets exhibit provide us clean examples of these three phases in their 10 year bull runs which ended in crashes. Phase III is characterized by violent and deep yet short term corrections which shakeout all but the strongest hands. That is what the government bond market is undergoing in this recent violent move. First let's review those two bull markets in the NASDAQ and oil.
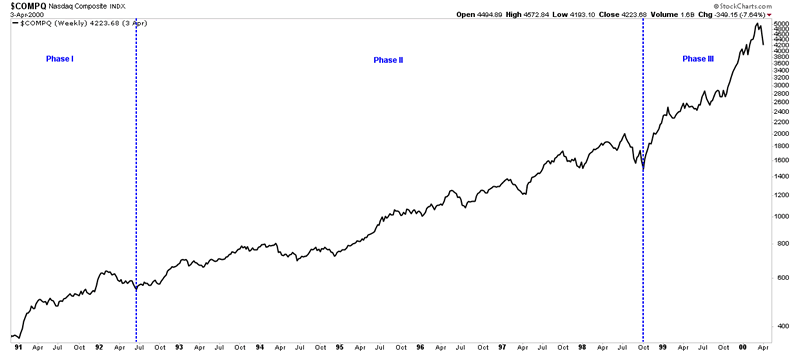
NASDAQ 1992-2000 Chart
Light Crude Oil 1999-2009 Chart
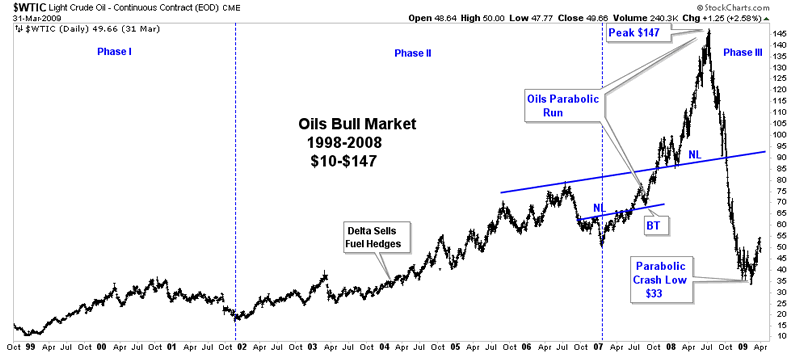
Both of these bull markets lasted about 10 years and went through all three psychological phases. The critical thing to note is the violent short term correction that these indexes underwent between phase II and III. It served to clear the decks and set itself up for the final blow off phase. Note the NASDAQ corrected 27% in 4 months in 1998 and the oil market corrected 38% in the 6 months after August 2006. These violent corrections are typical of early mania phase III markets after which markets go into mania blow off peaks.
Bond Market correction in phase III or new bear market?
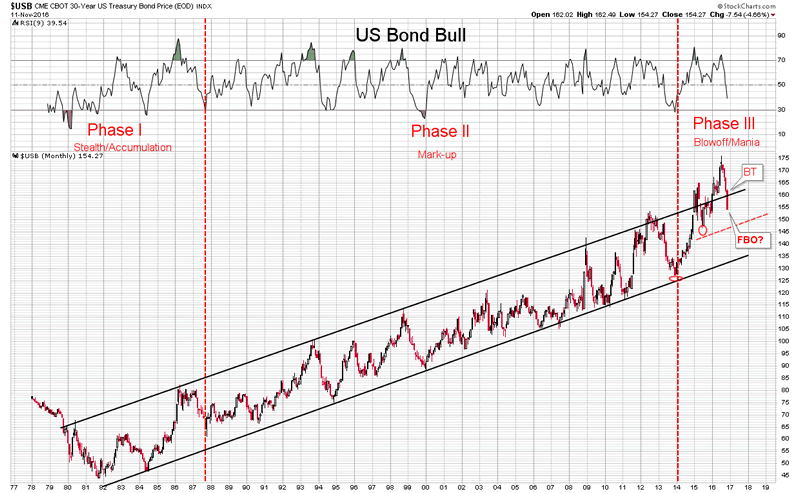
The violent sell off we have just witnessed in treasuries is simply normal action setting up for a final mania blow off in bonds. Obviously this would be driven by an economic contraction resulting in a further dive in interest rates. Interest rates would drop because economic activity cannot support higher rates. This seems counter intuitive with expectations of Trump infrastructure driven spending, however this is what I believe the chart of the long term government bond is telling us. Keep in mind that draining the swamp and ridding Wall Street of corruption could pull those rotten props out from under what has been artificially elevating the economy. After a honeymoon rally in stocks and further pressure in bonds the prevailing trend should continue. Forecast ahead: After this shake out is over, higher bond prices.
US Bond Bull Market 1978-2016 Monthly Chart
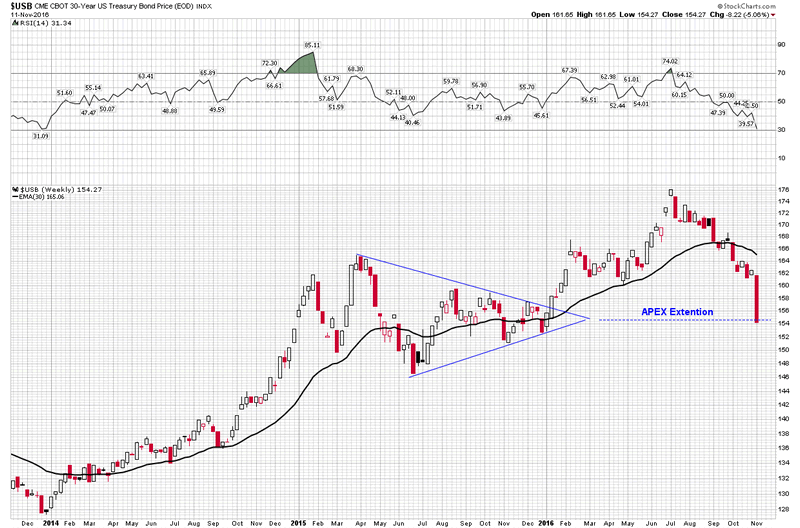
30-Year US Treasury 3-Year Chart
Plunger
Copyright © 2016 Plunger - All Rights Reserved
All ideas, opinions, and/or forecasts, expressed or implied herein, are for informational purposes only and should not be construed as a recommendation to invest, trade, and/or speculate in the markets. Any investments, trades, and/or speculations made in light of the ideas, opinions, and/or forecasts, expressed or implied herein, are committed at your own risk, financial or otherwise. The information on this site has been prepared without regard to any particular investor’s investment objectives, financial situation, and needs. Accordingly, investors should not act on any information on this site without obtaining specific advice from their financial advisor. Past performance is no guarantee of future results.
© 2005-2022 http://www.MarketOracle.co.uk - The Market Oracle is a FREE Daily Financial Markets Analysis & Forecasting online publication.