The Future Price Of Gold Will Drop Below $1000 In 2017
Commodities / Gold and Silver 2016 Nov 12, 2016 - 05:40 PM GMTBy: InvestingHaven
 As the price of gold and silver came down sharply, many investors are asking what the future price of gold will be. Although we do not pretend to have a crystal ball, we observe sufficient signals in the charts to make a make a call about the future price of gold into 2017.
In general, the precious metals market has turned very sour. Gold registered it largest loss on a weekly basis since it crashed in 2013. Moreover, gold and silver miners, said to lead the precious metals complex, have truly crashed this week.
Still, mainstream media, which we consider a barometer for sentiment, remains very moderate. That should be considered a bearish sign. These are some of the headlines of today, as gold lost more than 5 percent in two days, silver almost 15 percent in two days and precious metals miners even more than 15 percent:
- Gold Prices Reach Five-Month Low by Wall Street Journal
- Gold prices drop to fresh 4-week lows by Investing.com
- Gold suffers largest weekly loss in more than 3 years (this one is not very moderate though) by MarketWatch
The only analysis that is truly bearish appeared on Seeking Alpha the future price of gold was forecasted to drop below $1000. Though that article was not written by ourselves, we come to the same conclusion when analyzing price behavior and sentiment. And it surely confirms our proper gold price forecast for 2017.
Future price of gold points to $1000/oz as the most likely 2017 forecast
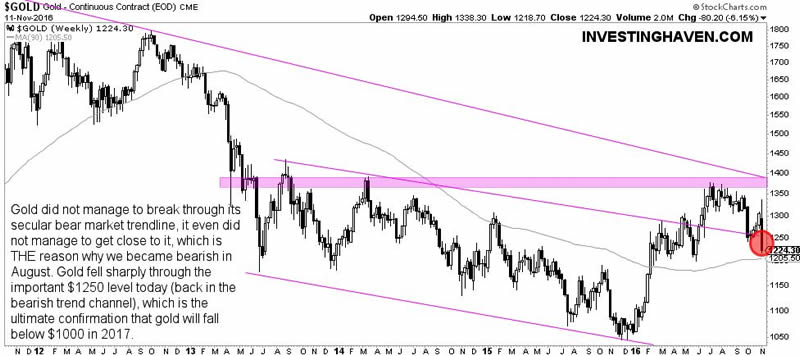
The gold chart sent a clear signal this week. As seen on the first chart, gold dropped below the important $1250 level. The price of gold clearly returns in the same bearish trend channel which started with the big collapse of April/June of 2013.
With that, we get the ultimate confirmation that gold is still in a longer term bear market, and that it is moving to the lower area of the channel which is below $1,000 /oz.

Generally speaking, the challenge understanding gold is that it has two faces. On the one hand, it is an inflationary asset, rising as inflation expectations rise. On the other hand, it is a fear asset, rising when fear enters the market.
Throughout the first 6 months of 2016, markes were driven by fear, which is the reason why gold was rising. However, at a certain point, fear stopped acting as a primary trend, and gold stopped rising. Even if there is some inflation, gold seems to act as a fear asset at this point, and investors should respect that signal.
The Yen confirms gold’s price behavior
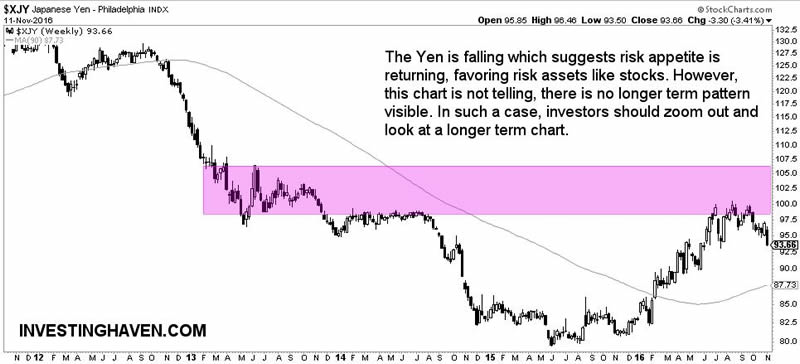
The Japanese Yen is said to be a global risk indicator, similar to gold. In recent weeks, the Yen has been falling steadily, after it rose sharply throughout 2015. What can we derive from that? The difficulty is that the weekly 5-year chart does not express any relevant pattern. In such a case, investors should zoom out until a relevant pattern becomes visible.

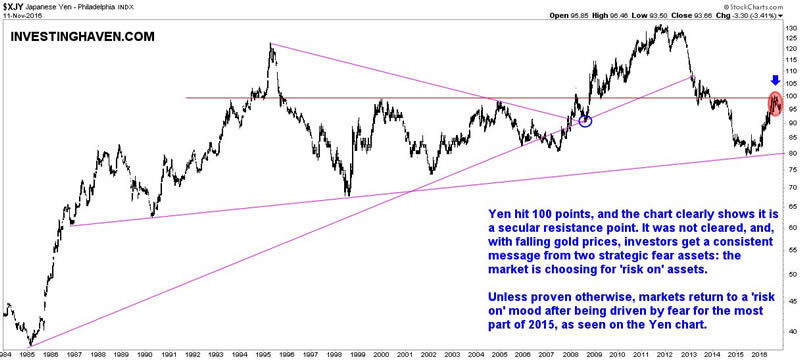
When zooming out, we observe an extremely interesting and important fact: the Yen stopped rising exactly at major resistance, at the red line on the chart below. It appears that 100 points in the Yen index has a very high importance. The fact that the Yen got so much resistance at that level confirms our conclusion from the gold market.

Warning: High Yield bonds
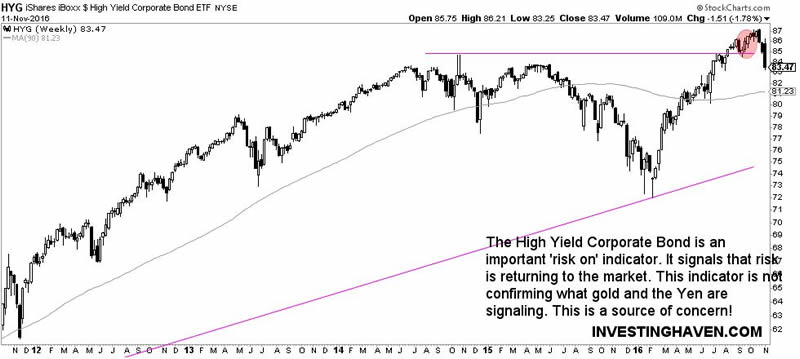
Though the Yen and the price of gold both confirm that the future gold price has a very bearish bias, there is one risk indicator which is not ‘convinced’ at this point, i.e. High Yield bonds (symbol HYG). The next chart makes that point. Investors should pay close attention at which point HYG stops falling.

Conclusion
We would not exclude that gold would retest its 1980 highs at $850, though we do not expect gold to trade for a long time at that price level (it is more of a worst case scenario). We explained in much more detail how we came to that conclusion in past articles, but, today, we got additional confirmation about the validity of that scenario from intermarket dynamics (first and foremost with a falling Yen after it hit secular resistance). The High Yield bond market should be watched closely though for the reasons outlined above.
Analyst Team
The team has +15 years of experience in global markets. Their methodology is unique and effective, yet easy to understand; it is based on chart analysis combined with intermarket / fundamental / sentiment analysis. The work of the team appeared on major financial outlets like FinancialSense, SeekingAlpha, MarketWatch, ...
Copyright © 2016 Investing Haven - All Rights Reserved Disclaimer: The above is a matter of opinion provided for general information purposes only and is not intended as investment advice. Information and analysis above are derived from sources and utilising methods believed to be reliable, but we cannot accept responsibility for any losses you may incur as a result of this analysis. Individuals should consult with their personal financial advisors.
© 2005-2022 http://www.MarketOracle.co.uk - The Market Oracle is a FREE Daily Financial Markets Analysis & Forecasting online publication.


