


Did U.S. Treasury Bonds Just Get Stumped by Trump?
Interest-Rates / US Bonds Nov 12, 2016 - 10:17 AM GMTBy: EWI

 The answer to where T-Bonds are headed is not in the news headlines about Trump. It's in the Elliott wave pattern
On November 9, the United States woke to the biggest political shock since Harry Truman defeated "shoe-in" Thomas E. Dewey in the 1948 U.S. presidential election.
For U.S. bond investors, the 2016 election has been head-spinning too.
In the weeks leading up to the November 8 vote, the ground beneath U.S. Treasuries seemed as stable as log-rolling competition. Have things calmed down now that Donald Trump has been named the next leader of the free world?
Not at all. If anything, things have gotten worse. As these November 9 news items make plain, bonds continue to be stumped by Trump:
Trump victory is bearish for bonds; i.e. yields rise and prices fall -- "Long-dated Securities Drop as Trump Seen as Spendthrift President." (Bloomberg)
Trump victory is bullish for bonds; i.e. yields fall and prices rise: "Investors dashed into the perceived shelter of U.S. Treasury bonds, crushing yields, on speculation that Donald Trump will win." (Financial Times)
Again, Trump victory is bearish for bonds: "Treasuries Selloff Following Trump Victory." (Barron's)
No, just kidding. Trump win is bullish for bonds: "Treasuries Lead Global Bond Rally as Trump Set to Win Election" (Bloomberg)
Back and forth, and back and forth, with no end in sight. It's the worst-possible scenario for investors seeking clarity into where U.S. treasuries will trend in the coming days and weeks.
Now for the good news: The near- and long-term trend changes in Treasuries are not tied to the ever-shifting opinions about Trump. In our opinion, they are driven by investor psychology, which unfolds in Elliott wave patterns on price charts.
To see some evidence of that, let's remove the alleged "Trump" card for a second and review the recent performance in the 30-year Treasury bond market.
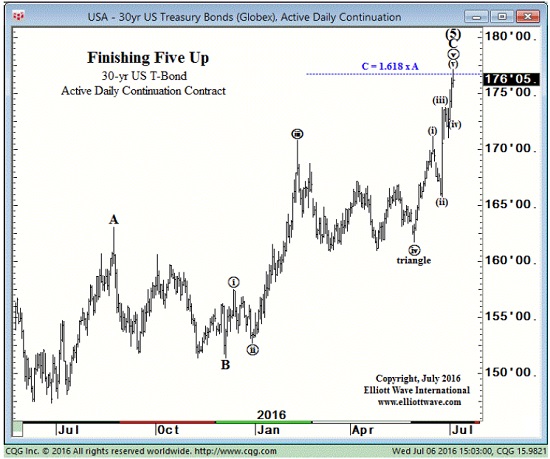
In July of this year, the 30-year Bond yield was circling the drain of an all-time record low for the biggest bond-prices bull market in over 50 years.
At the time, the news du jour wasn't Trump, it was Brexit; specifically, the June 23 referendum vote by Britain to leave the European Union.
According to the news-moves-markets' pundits, the Brexit bombshell was set to keep the risk-aversion fire ablaze -- and by proxy, bond yields cold as ice. Here, these July 1 news items capture the sentiment at the time:
"There's no natural boundary for yields on the low end. 10-year yields at 1% or even lower by year-end, while the 30-year yield could take another 100 basis point tumble, that decline would be easy." (Reuters July 1)
"I think we just have to accept that this is a low yield world until further notice." (L.A. Times July 1)
But in our opinion, the one-sided bullishness surrounding bond prices, combined with a near-complete Elliott wave pattern, suggested the bond price rally was coming to an abrupt end. Our July 1 Financial Forecast's Short Term Update sounded the alarm first:
"The Daily Sentiment Index of bond traders is up to 95% bulls and the Commitment of Traders data shows that Large Specs (as % of OI) were at 15.44% as of two weeks ago, an all-time record net-long position.
"The belief that bond prices will continue to rally and yields will continue to decline is near universal, which, ironically, is exactly the condition that attends trend reversals.
"A decline through 173^05.0 will indicate that a top in prices is in place. Prices could fall another 5-10 points very quickly thereafter."
The next chart shows that, despite the daily knee-jerk reactions to Trump's nomination (and now, victory) yields have indeed kept a steady course to the upside, with prices to the downside:
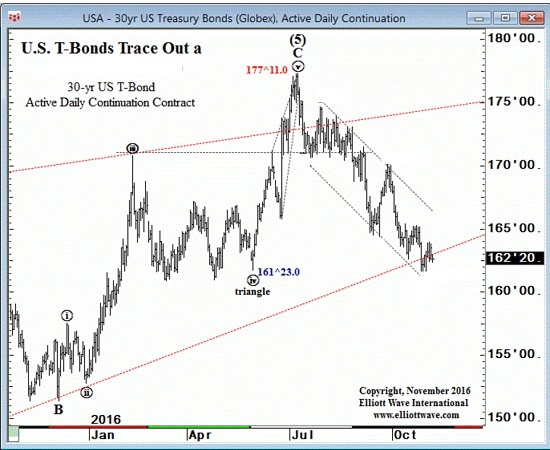
Bond market volatility surrounding the presidential election isn't going to die down any time soon.
Fortunately, that won't interrupt your ability to gain objective insight into the world's leading bond market -- should you choose the Elliott wave method as your road map.
Unleash the power of the Wave PrincipleMuch like a great sports play; to appreciate a great market forecast, you have to see it. In fact, we'd like to show you four. Our examples do indeed show what can happen when Elliott analysis meets opportunity. But we're not asking you to attend a class in 'good calls.' In each of these four markets, the unfolding trends have (once again) reached critical junctures. You really, really want to see what we see, right now. Get your report -- How to Find Real Opportunities in the Markets You Trade -- FREE |
This article was syndicated by Elliott Wave International and was originally published under the headline Did U.S. Treasury Bonds Just Get Stumped by Trump?. EWI is the world's largest market forecasting firm. Its staff of full-time analysts led by Chartered Market Technician Robert Prechter provides 24-hour-a-day market analysis to institutional and private investors around the world.
About the Publisher, Elliott Wave International
Founded in 1979 by Robert R. Prechter Jr., Elliott Wave International (EWI) is the world's largest market forecasting firm. Its staff of full-time analysts provides 24-hour-a-day market analysis to institutional and private investors around the world.
© 2005-2022 http://www.MarketOracle.co.uk - The Market Oracle is a FREE Daily Financial Markets Analysis & Forecasting online publication.