


END OF THE U.S. MAJOR OIL INDUSTRY ERA: Big Trouble At ExxonMobil
Commodities / Oil Companies Nov 04, 2016 - 04:39 AM GMTBy: Steve_St_Angelo

 The era of the mighty U.S. major oil industry is coming to an end as the country’s largest petroleum company is in big trouble. While ExxonMobil has been the most profitable U.S. oil company in the past, it suffered its worst year on record.
For example, just four years ago, ExxonMobil enjoyed a $45 billion net income profit in 2012. Now compare that to a total $5 billion net income gain for the first three-quarters of 2016. If Exxon continues to report disappointing results for the remainder of the year, its net income will have declined a stunning 85% since 2012.
Actually, the situation at Exxon is much worse if we dig a little deeper.
Profitability Is Much Less When We Factor in Capital Expenditures
To understand the real profitability of a company we have to look at its cash flow, or what is known as free cash flow. Free cash flow is calculated by deducting capital expenditures (CAPEX) from the company’s cash from operations. ExxonMobil’s free cash flow declined from $24.4 billion in 2011 to $1 billion for the first nine months of 2016:
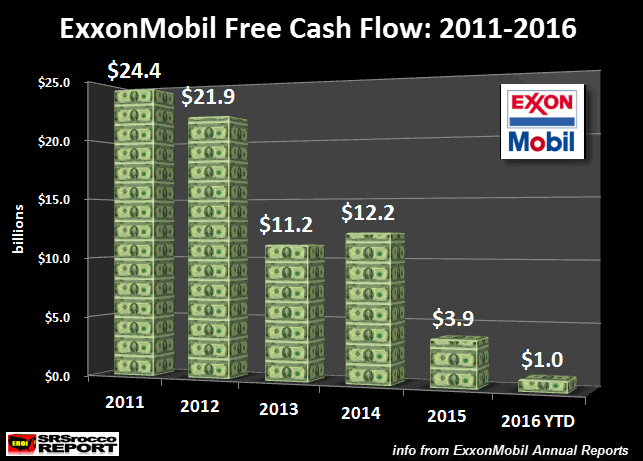
So, here we can see that Exxon’s free cash flow of $1 billion (2016 YTD) is down 95% from $24.4 billion in 2011. The reason for the rapidly falling free cash flow is due to skyrocketing capital expenditures and falling oil prices. But, this is only part of the picture.
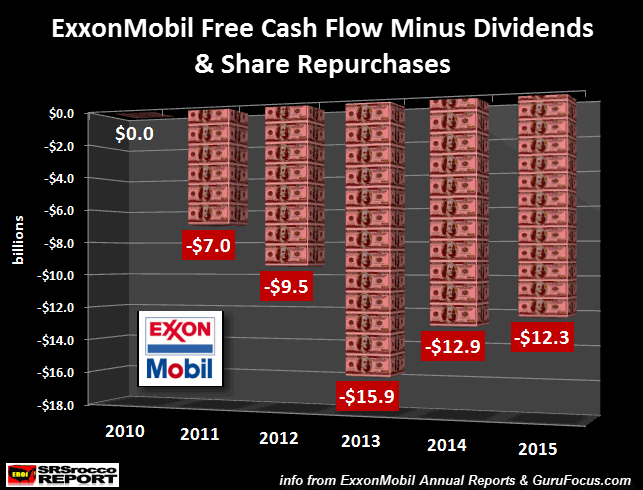
If we include dividend payouts, Exxon’s financial situation drops down another notch. While free cash flow does not include dividend payouts, the money Exxon pays its shareholders must come from its available cash. By including dividend payouts, the company was $8.3 billion in the hole in 2015:
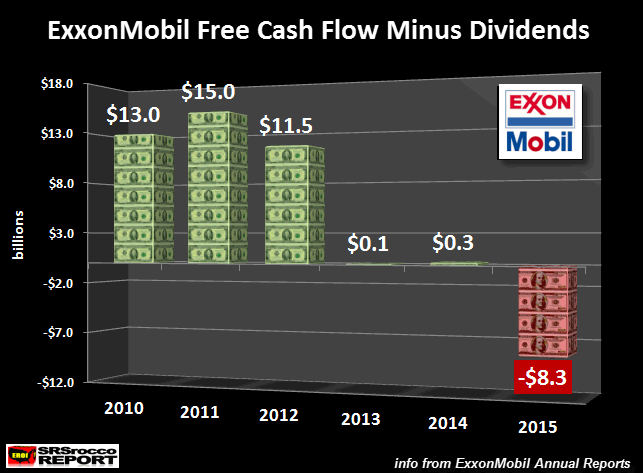
Now, even though Exxon stated a $45 billion net income for 2012, its free cash flow minus dividends was only $11.5 billion. Moreover, the company didn’t make any money in 2013 or 2014 after dividends were paid to their shareholders. Thus, deducting dividends from the equation provides a more realistic picture, especially since Exxon has been forking out serious sums of money to its shareholders.
That being said, there seems to be something seriously wrong going on at Exxon when we look at the long-term chart below:
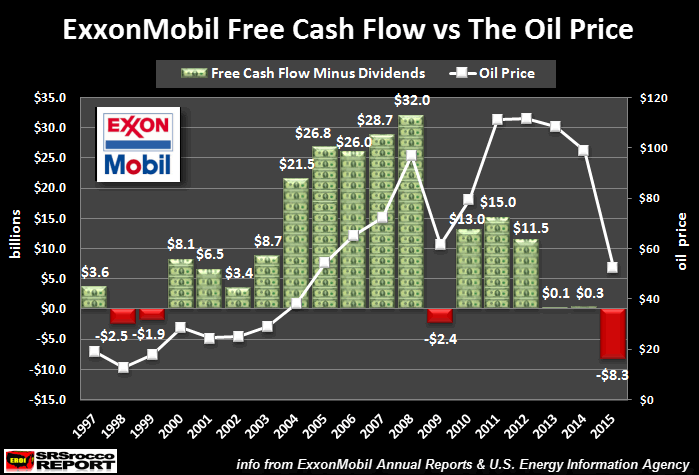
Let me start off by saying, this chart is an extension of the chart above it. Even though the title doesn’t include dividend payouts, the legend in the chart displays it. The white line represents the average annual oil price. There are several important factors shown in this chart.
- As the price of oil increased from $20 in 2002 to $97 in 2008, Exxon’s free cash flow minus dividends surged to $32 billion from $3.4 billion. Thus, the higher oil price led to larger free cash flow profits. Well, that was the good news.
- The bad news is, Exxon’s surplus cash declined significantly when the oil price was over $100 from 2011 to 2013. Even though the oil price in 2011 and 2012 was higher than it was in 2008, the company’s free cash flow including dividends was less than half. Furthermore, Exxon made no surplus cash in 2013 when the oil price was above $100.
- While Exxon enjoyed surplus cash over $20 billion from 2004 to 2007 when the price of oil was between $38 and $72, how is it that the company made no surplus cash in 2013 when the oil price was north of $100?? We will get into that in a minute.
- Even though Exxon suffered negative free cash flow (including dividend payouts) in 1998 (-$2.5 billion) and 1999 (-$1.9 billion), the oil price was at a low of $13 and $18 respectively. Compare that to a cash deficit of $8.3 billion in 2015 at an average oil price of $52…. triple of what is was during the 1998 and 1999.
- The reason for the huge decline in ExxonMobil’s surplus cash, even at much higher oil prices, was due to two factors; 1) higher capital expenditures and, 2) higher dividend payouts.
While higher dividend payouts put more stress on the company’s financial situation, the real problem is the massive increase in capital expenditures
The Massive Increase Of Capital Expenditures Is Causing Havoc At ExxonMobil
Very few investors realize the devastating impact of rising capital expenditures on Exxon’s financial bottom line. This chart shows annual capital expenditures versus the company’s oil (total liquid) production:
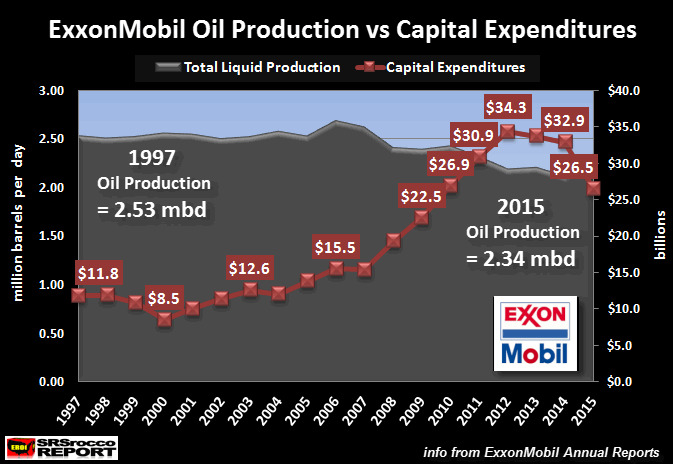
For example, in 1997, Exxon spent $11.8 billion on capital expenditures while producing 2.5 million barrels per day (mbd) of oil. However, their capital expenditures nearly tripled to $34 billion in 2012 as total liquid production fell to 2.2 mbd. Basically, Exxon spent three times more money in 2012 to produce 300,000 barrels per day less than it did in 1997.
When the company realized towards the end of 2013 that the market would not afford to pay $120 a barrel (the cost for new oil projects), Exxon started cutting back on exploration and capital expenditures. Even though total liquid production increased to 2.34 mbd in 2015, capital expenditures declined to $26.5 billion.
Unfortunately, the situation continued to deteriorate in 2016. According to Exxon’s Q3 report, capital expenditures in the first nine months of the year declined another 40% compared to the same period in 2015. Without increased capex spending, it is going to be quite difficult for the company to sustain production and to remain profitable.
So, when we consider that Exxon had to triple its capex spending to maintain production as well as increase dividend payouts to keep shareholders happy, the falling oil price is totally gutting the company from within.
While the evidence shown here is bad enough, I hate to be a broken record, but the situation is even far worse for Exxon when include two more negative factors.
Exxon Spent The Majority Its Surplus Cash To Buy Back Shares Rather Than Fund New Oil Projects
It seems as if Exxon realized early on that peak oil had finally arrived (privately, of course), so it decided to not waste too much money on future oil projects. Instead, the company spent a massive amount of money on stock repurchases over the past two decades… especially since 2005.
While Exxon had been repurchasing their stock for several years, I had no idea of the total amount. You see, the net total free cash flow, including dividends, for Exxon was $190 billion from 1997-2015. Looking over company’s balance sheet, I had no idea where all that money had gone. I was talking to financial expert Vic Patane a few days ago, and he said, “You should check out their stock repurchases. So, I did… and what a surprise.
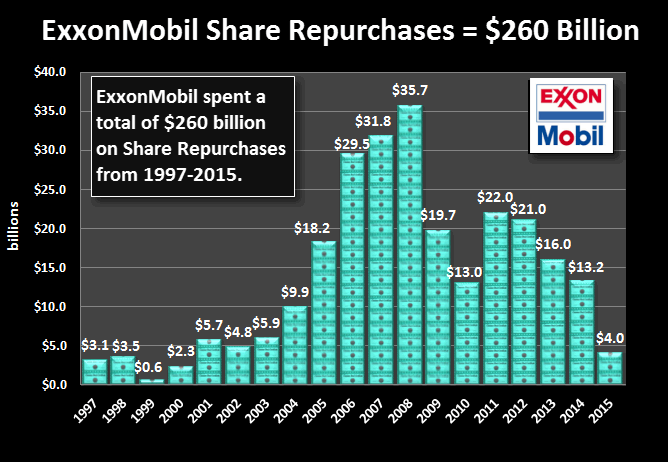
According to ExxonMobil’s Annual Reports, the company spent a staggering $260 billion on stock repurchases since 1997:
The loin’s share of their stock buybacks were between 2005 and 2014. In that ten-year period, Exxon purchased a staggering $220 billion of its own shares. Now compare that to the company’s total capex spending of $245 billion during the same time period:
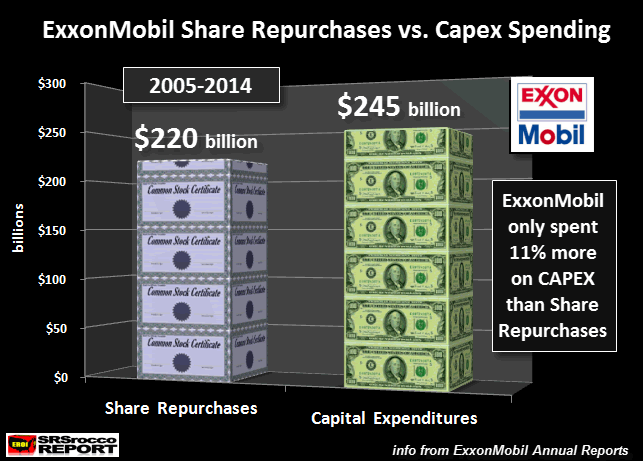
Amazingly, Exxon only spent 11% more on it total capital expenditures than it did on stock buybacks. Which means, the largest oil company in the United States decided to repurchase roughly a third of its outstanding shares (2005 to 2014), than use its surplus cash to fund new oil projects. Exxon’s outstanding shares declined from 6.1 billion in 2005 to 4.2 billion in 2014.
This is certainly an interesting way for the leading U.S. oil company to use its surplus cash. For those who continue to be skeptics of the peak oil theory, YOU NEED TO WAKE UP AND LOOK AT THE DATA.
Okay, now that we know the lower oil price is gutting the entire U.S. oil industry, what is it doing specifically to Exxon? Good question.
Exxon’s Long Term Debt Surges In The Last Three Years
Before I present Exxon’s chart on its rising long-term debt, we need to look at the impact of the company’s share buybacks on its bottom line. When factoring in Exxon’s share repurchases on top of its increasing capital expenditures and dividend payouts, the company’s financial situation started to deteriorate in 2011… when the oil price shot up to $110… GO FIGURE:
So, if we include share buybacks, capex spending and dividend payouts, Exxon basically broke even in 2010 and actually had to start tapping into cash reserves or borrow money to fund their deficits. In just five years (2011-2015), the company spent $58 billion more than they received from operating cash.
This has had a profound impact on Exxon’s long-term debt, shown below:
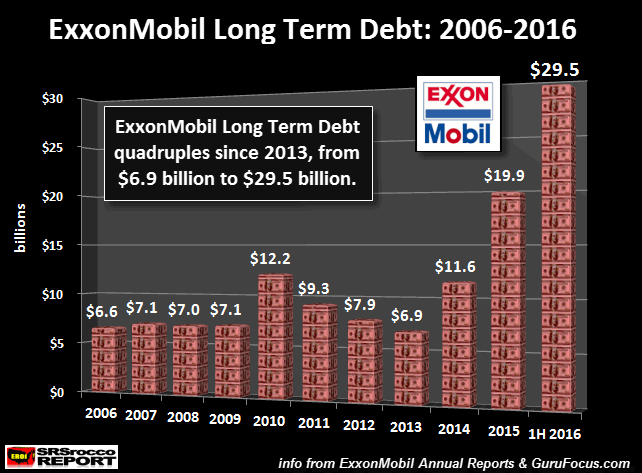
As we can see, Exxon’s long-term debt has exploded from $6.9 billion in 2013 to $29.5 billion in the first half of 2016. Basically, the company is now borrowing money to repurchase shares or pay dividends. This is not a viable long-term business model.
And, we are already seeing the negative ramifications of low oil prices as Exxon only repurchased $4 billion of its shares in 2015 versus $35.7 billion back in 2008.
Investors need to realize the situation in the U.S. major oil industry is in BIG TROUBLE. If the largest oil company in the country is already suffering, what does it say for the rest of the industry?? Well, let me give you just one example.
Chevron is the second largest oil company in the United States. In 2015, Chevron spent a stunning $18.2 billion more on capital expenditures and dividend payouts than the company’s operating cash. Thus, Chevron spent $10 billion more than ExxonMobil did last year ($8.3 billion after capex and dividends).
This paints a very gloomy picture for the sustainability of the one great U.S. major oil industry, especially when oil prices continue to decline. As was mentioned in previous articles, the Hills Group and Louis Arnoux forecast that within ten years, 75% of U.S. gas stations will be closed, and the oil industry as we know it, will have disintegrated.
Well, it seems as if their forecast is playing out just as they forecasted as Exxon recently announced some extremely bad news.
Exxon To Write Off 20% Of Its Petroleum Reserves
I don’t know how many American’s caught this little tidbit released last week when Exxon stated its Q3 report, but it was a whopper. According to the article, Exxon Warns On Reserves As It Posts Lower Profit:
Exxon Mobil Corp. warned that it may be forced to eliminate almost 20% of its future oil and gas prospects, yielding to the sharp decline in global energy prices.
Under investigation by the U.S. Securities and Exchange Commission and New York state over its accounting practices—and the impact of future climate change regulations on its business—Exxon on Friday disclosed that some 4.6 billion barrels of oil in its reserves, primarily in Canada, may be too expensive to tap.
From what I have read, the 4.6 billion barrel reserve write-off is mostly from its oil sand projects in Canada and its onshore shale deposits in the United States. However, this amounts to more than 20% of ExxonMobil’s oil or liquid petroleum reserves.
At the end of 2015, the company reported a total of 24.7 billion barrels of oil equivalent. That figure includes oil, liquids and natural gas. However, if we just consider their oil and liquid reserves of only 14.7 billion barrels, a 4.6 billion barrel write down would amount to nearly one-third of their oil reserves. This is much greater than the 20% stated in the article.
When Exxon reduces its oil and liquid reserves by 4.6 billion barrels, it will only have 12 years worth of reserves remaining, at current production levels. But, what if the price of oil continues to decline toward the $12 maximum price suggested in The Hills Group Report by 2020? What would that do to Exxon or other U.S. oil companies’ reserves and future oil production??
The 100+ year era of the U.S. major oil industry is coming to an end… and fast. Unfortunately, Americans have no clue just how dire the situation has become as many probably still believe in the delusion of “U.S. Energy Independence.”
I would imagine by 2020, the U.S. will be a much different place. Regrettably, most Americans are not prepared.
Check back for new articles and updates at the SRSrocco Report. You can also follow us at Twitter, Facebook and Youtube below:


2016 Copyright Steve St .Angelo - All Rights Reserved Disclaimer: The above is a matter of opinion provided for general information purposes only and is not intended as investment advice. Information and analysis above are derived from sources and utilising methods believed to be reliable, but we cannot accept responsibility for any losses you may incur as a result of this analysis. Individuals should consult with their personal financial advisors.
© 2005-2022 http://www.MarketOracle.co.uk - The Market Oracle is a FREE Daily Financial Markets Analysis & Forecasting online publication.