Shocking Downward Revisions to US GDP From Growth to Recession
Economics / Recession 2008 - 2010 Jul 31, 2008 - 01:52 PM GMTBy: Mike_Shedlock

 Tomorrow, the Nonfarm Payroll Numbers are out. I made my forecast last night ahead of today's numbers. My predictions can be found in July Payroll Playbook .
Weekly Claims
The Weekly Uninsurance Claims Report for the week ending July 26 is out. It is a disaster.
Seasonally Adjusted Data
In the week ending July 26, the advance figure for seasonally adjusted initial claims was 448,000, an increase of 44,000 from the previous week's revised figure of 404,000. The 4-week moving average was 393,000, an increase of 11,000 from the previous week's revised average of 382,000.
The advance seasonally adjusted insured unemployment rate was 2.5 percent for the week ending July 19, an increase of 0.2 percentage point from the prior week's unrevised rate of 2.3 percent.

Calculated Risk has some interesting charts in Weekly Claims Hit 5 Year High .
Recession Going To Widen, Deepen
Reality starting to set in: U.S. Recession May Have Begun in Last Quarter of 2007 .
The U.S. economy may have slipped into a recession in the last three months of 2007 as consumer spending slowed more than previously estimated and the housing slump worsened, revised government figures indicated.
The world's largest economy contracted at a 0.2 percent annual pace in the fourth quarter of last year compared with a previously reported 0.6 percent gain, the Commerce Department said today in Washington. Growth for the period from 2005 through 2007 was also trimmed.
"We're in a recession," Allen Sinai, chief economist at Decision Economics Inc. in New York, said in a Bloomberg Television interview. "It's going to widen, it's going to deepen."
Nine of the 13 quarters under review were revised down, three increased and one was unchanged.
The largest downward revision was for the last three months of 2007, as the previously reported 2.3 percent gain in consumer spending was reduced by more than half, to 1 percent. Americans cut back on the use of electricity and gas as fuel bills soared.
"While everyone focuses on GDP, keep in mind that it is not the only barometer of economic activity," David Rosenberg, chief North American economist at Merrill Lynch & Co. in New York, said in a July 28 note to clients. Growth "is subject to huge historical revisions."
The four other factors that the NBER takes into account, Rosenberg said, peaked between October 2007 and February 2008. The NBER usually declares a recession has started between six to 18 months after it's begun, according to its Web site.
Pollyannas Need To Change Their Tune
All the Pollyannas need to change their tune. I am sticking with the tune I sung in Case for an "L" Shaped Recession .
By the way, that revision was buried on page 11 of the latest Advance GDP numbers out today . The first two quarters of 2008 are positive but I bet those get revised lower down the road. Furthermore, it does not take two consecutive quarters of negative GDP to call a recession as is widely believed.
The National Bureau of Economic Research, the Cambridge, Massachusetts-based arbiter of economic cycles, defines a recession as a "significant" decrease in activity over a sustained period of time. The declines would be visible in GDP, payrolls, production, sales and incomes.
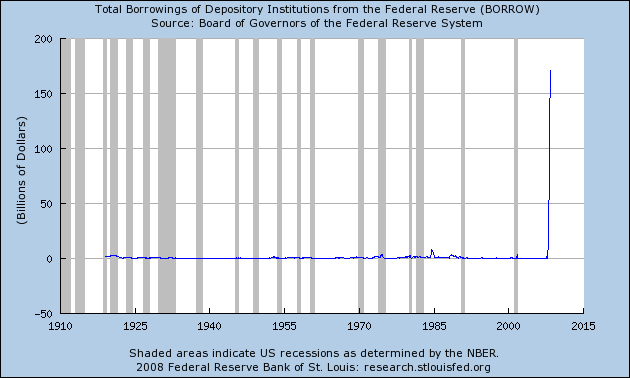
Total Borrowings Of Depository Institutions Soar

The above Borrow Series Chart thanks to St. Louis Fed
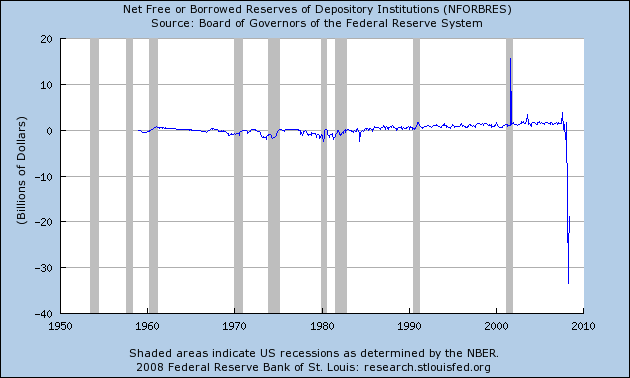
Non-Borrowed Reserves
Following is a chart of Net Free or Borrowed Reserves of Depository Institutions.

The above NFORBRES Series Chart thanks to St. Louis Fed.
Never before in history have we seen charts like the above. Those are two more indications of an unsound financial system.
If you have not already seen it, I mentioned 25 indications of an unsound financial system in You Know The Banking System Is Unsound When....
By Mike "Mish" Shedlock
http://globaleconomicanalysis.blogspot.com
Click Here To Scroll Thru My Recent Post List
Mike Shedlock / Mish is a registered investment advisor representative for SitkaPacific Capital Management . Sitka Pacific is an asset management firm whose goal is strong performance and low volatility, regardless of market direction.
Visit Sitka Pacific's Account Management Page to learn more about wealth management and capital preservation strategies of Sitka Pacific.
I do weekly podcasts every Thursday on HoweStreet and a brief 7 minute segment on Saturday on CKNW AM 980 in Vancouver.
When not writing about stocks or the economy I spends a great deal of time on photography and in the garden. I have over 80 magazine and book cover credits. Some of my Wisconsin and gardening images can be seen at MichaelShedlock.com .
© 2008 Mike Shedlock, All Rights Reserved
Mike Shedlock Archive |
© 2005-2022 http://www.MarketOracle.co.uk - The Market Oracle is a FREE Daily Financial Markets Analysis & Forecasting online publication.


