Stocks, Crude Oil and EURUSD Trend Forecasts
Stock-Markets / Financial Markets 2016 Oct 24, 2016 - 03:22 PM GMTBy: Ken_Ticehurst
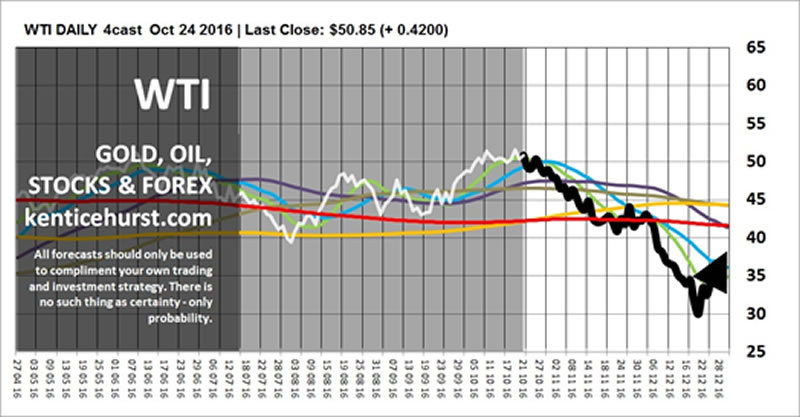
 We should now begin to see a drop in WTI over the next couple of months and in to 2017, so far the consolidation that has ocurred over the last few weeks has been as forecast and the next down phase we have been modelling for months is now due.

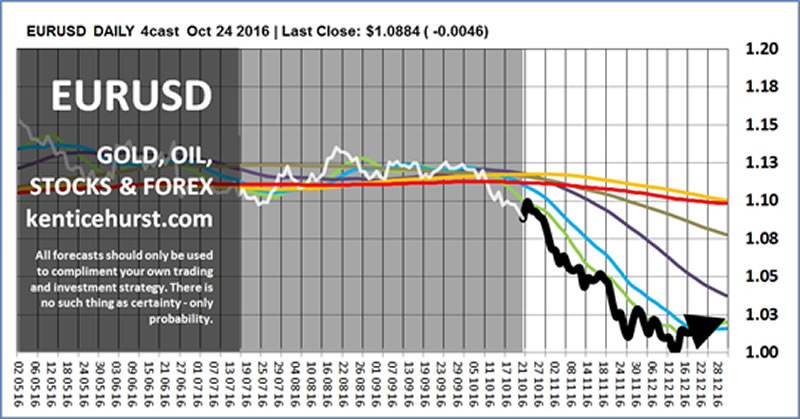
We have been forecasting for some time that the the Pound would be the weakest of the major currencies going forward and so far of all the major currencies it has been with the Euro not far behind.
Our forecast for a new down leg down in the Euro against the Dollar has remained on track for some time, we do now appear to beginning the next Dollar bull phase which could see parity within months. We expect this Dollar strength to be negative for many stock markets and other assets going forwards.

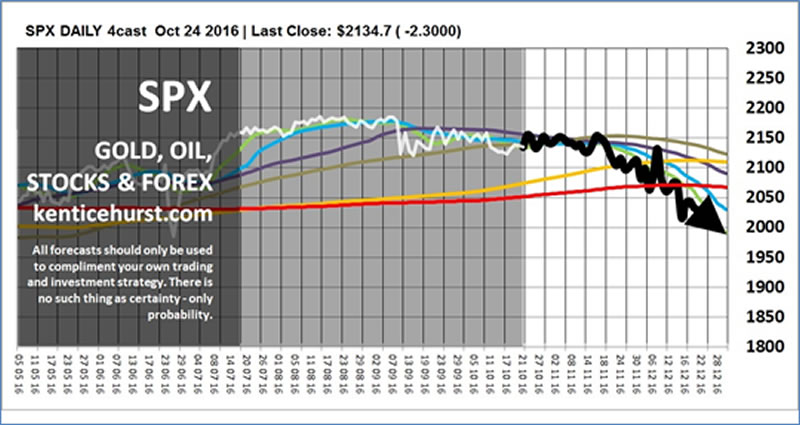
We are forecasting a correction in global stocks over the next six months, we think the SPX along with most of the major indices has put in a top, this fits in well with our commodity and forex forecasts. Our S&P500 forecast has remained on track for some time, it has been indicating that we are on the verge of a period of weakness it may take a few more weeks before we begin to see the market drop in earnest. We expect this weakness to extend well in to 2017.

We are still forecasting a new down leg in commodities, a stronger Dollar and an even stronger Yen during the fourth quarter of this year. We anticipate this Dollar strength will create the conditions for some key markets to sell off for a period which will relieve some over bought conditions necessary for a healthy market.
You can view live short term forecasts at our website, they are a representation of our medium and long term forecasts which always show the full picture, prices tend to be more random day to day than they are week to week or even month to month. Our short term forecasts are always anchored against these larger patterns that barley change from week to week, this is what allows us to be so confident with our shorter term forecasts in spite of the increase in volatility.
Taking patterns in nature that repeat over different time frames like fractals as the basis for the forecast methodology, our forecast patterns can last for months and years, we create a most probable long term fractal pattern and then continually test it and model it over multiple time frames to ensure the pattern remains a probable event.
Ken Ticehurst is the publisher of forecasts for a wide range of markets at kenticehurst.com he has a BSC (Hons.) in Industrial Design and decades of experience as a data analyst. Having used technical analysis during over ten years of trading, he became frustrated with how backward looking it is and set about creating a logical mathematical approach to analysing future prices.
Copyright 2016, Ken Ticehurst. All rights reserved.
Disclaimer: The above information is not intended as investment advice. Market timers can and do make mistakes. The above analysis is believed to be reliable, but we cannot be responsible for losses should they occur as a result of using this information. This article is intended for educational purposes only. Past performance is never a guarantee of future performance.
© 2005-2022 http://www.MarketOracle.co.uk - The Market Oracle is a FREE Daily Financial Markets Analysis & Forecasting online publication.


