


A perspective on risk rally – Risks abound but Stock Market is Confident
Stock-Markets / Stock Markets 2016 Oct 17, 2016 - 02:05 PM GMTBy: John_Mesh

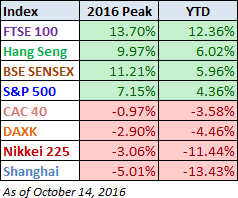
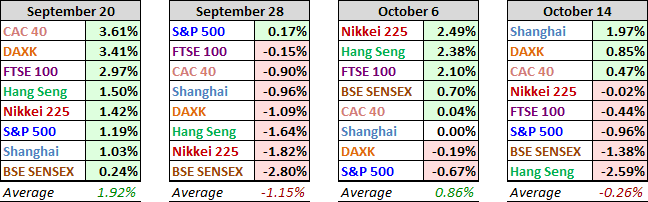
 Three of the major indexes posted gains and five posted losses. China's Shanghai Composite was the top performer, up 1.97% following the previous week of market closure celebrating Chinese National Day. Hong Kong's Hang Seng was the biggest loser, down 2.59%. The average of the eight was a modestly negative -0.26%. The tables below provide a concise overview of performance comparisons over the past four weeks for these eight major indexes. We've also included the average for each week so that we can evaluate the performance of a specific index relative to the overall mean and better understand weekly volatility. The colors for each index name help us visualize the comparative performance over time.
How strong is the US economic recovery compared to the peaks in 2000 and 2007...
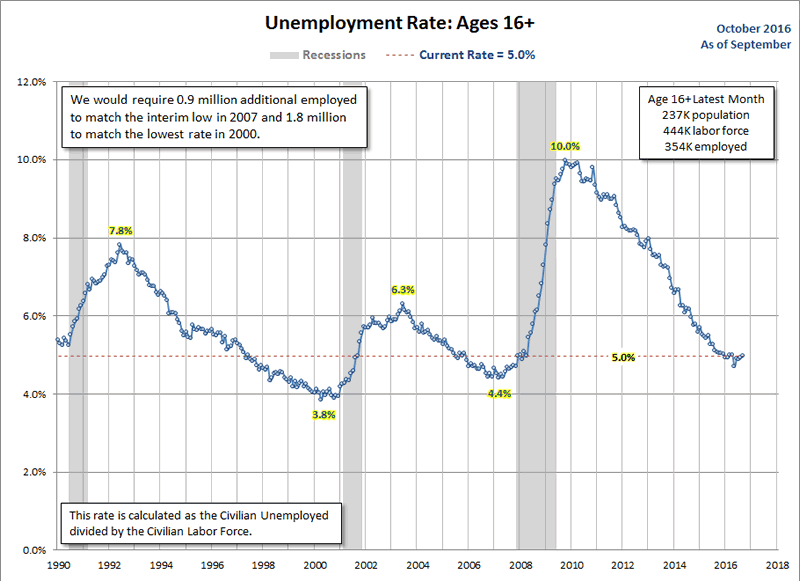
The closely watched headline unemployment rate is a calculation of the percentage of the Civilian Labor Force, age 16 and older, currently unemployed. Let's put that into its historical context. The first chart below illustrates this monthly data point since 1990. In the latest data this indicator remains at 4.3%. The age 16+ population grew by 237 thousand, and the labor force grew by 444 thousand, but the number of employed only grew by 354 thousand. Today's Civilian Employed would require 900,000 additional job holders to match its interim low in 2007, and we would need 1.8 million to match the lowest rate in 2000.
Employed to population ratio : Rebounding but well behind the 2007 peaks
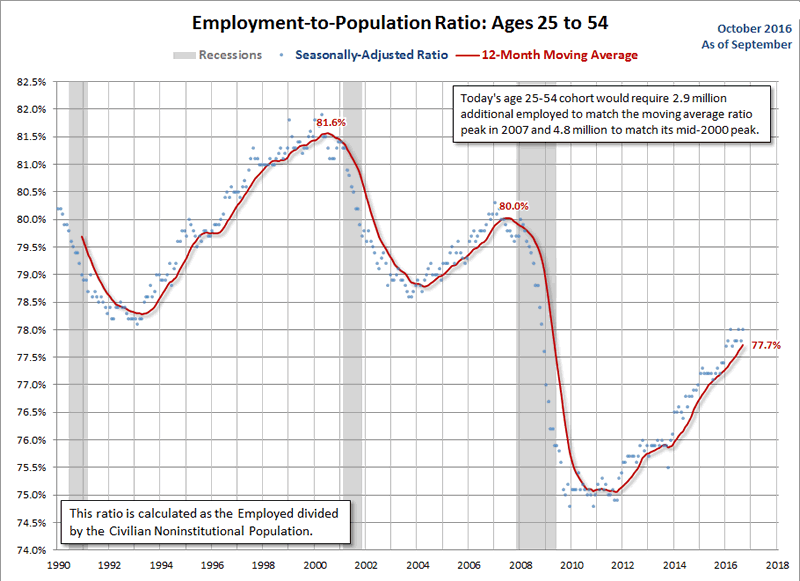
This metric began to rebound from its post-recession trough in late 2012. However, the more disturbing news is that the current age 25-54 cohort would require an increase of 2.9 million employed prime-age participants to match its ratio peak in 2007. To match its mid-2000 peak would require a 4.8 million participant increase.
The employement charts above show the structural weakness that has engulfed the US economy. This is even after trillions that have been poured into banking system. There has been rebound in business cycle activity since 2012 but that has not been good enough to match the hey days of US economy in 2000 and 2007. With the massive credit infusion and bailouts, it does seem that with the completion of these measures, US economy could be once again weaken.
US Services PMI
The final September US Services Purchasing Managers' Index conducted by Markit came in at 52.3 percent, up 1.3 percent from the final July estimate. The Investing.com consensus was for 51.9 percent (the September Markit preliminary reading). Markit's Services PMI is a diffusion index: A reading above 50 indicates expansion in the sector; below 50 indicates contraction.
Here is the opening from the latest press release:
U.S. service providers indicated an upturn in business activity growth from the six-month low recorded during August. Nonetheless, the pace of expansion remained modest and softer than its post-crisis trend, largely reflecting subdued new business gains in recent months. [Press Release]
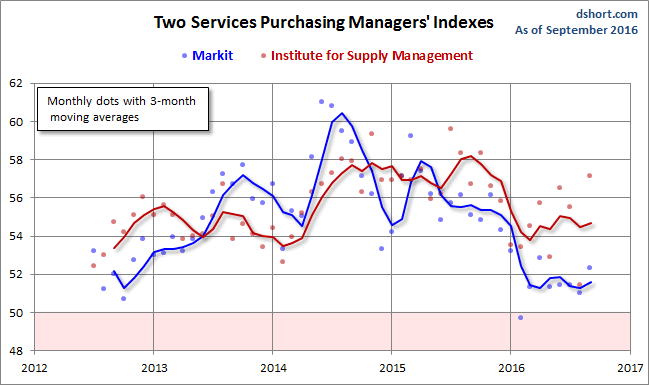
Both series have weakened over the past several months. The interim three-month moving average of the Markit Services index peaked in August of 2014. The ISM index peaked in September of 2015. The two were fairly closely aligned at the beginning of this year, but they have diverged in recent months with the Markit index signaling noticeably weaker growth.
JOLTS Job: Early job openings
JOLTS continues to show a solid labor market. Chair Yellen uses it as a signal for a tight labor market. The healthy “quit rate” shows that many people are comfortable in voluntarily leaving jobs. Some reports focused strictly on the number of job openings, which is a poor use of the data.
Jobless claims look fine
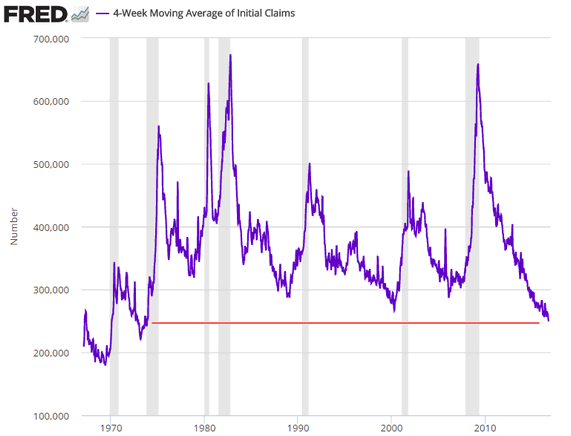
Initial jobless claims also show labor market strength.
Earnings look strong
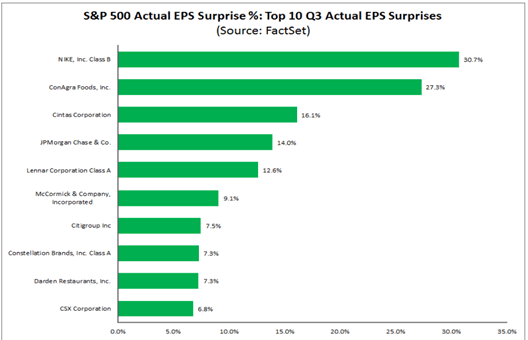
Corporate earnings nicely beat expectations. FactSet has some interesting early data – 76% of the reporting companies have beaten earnings expectations and 62% have beaten on sales.
However the following data and surveys show the declining optimism and worsening economic recovery
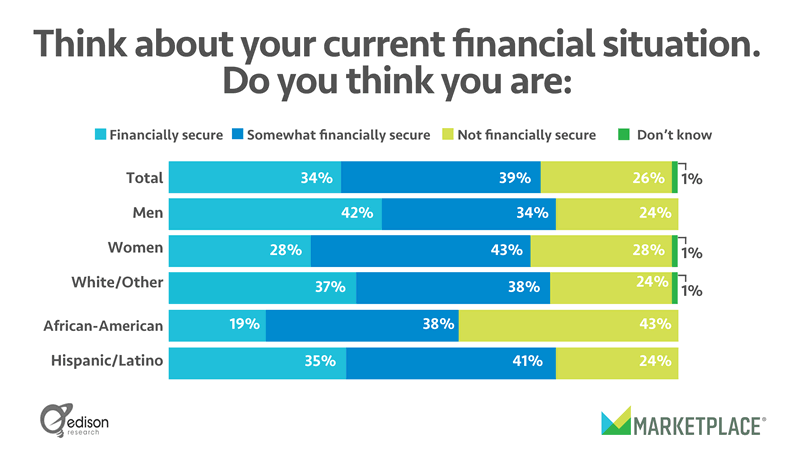
Thirty percent of Americans are very fearful they will lose their job in the next six months, up from 10 percent a year ago. And 39 percent of Americans say their personal financial situation actually causes them to lose sleep.
Read about it here: Survey
Consumer Sentiment is waning..
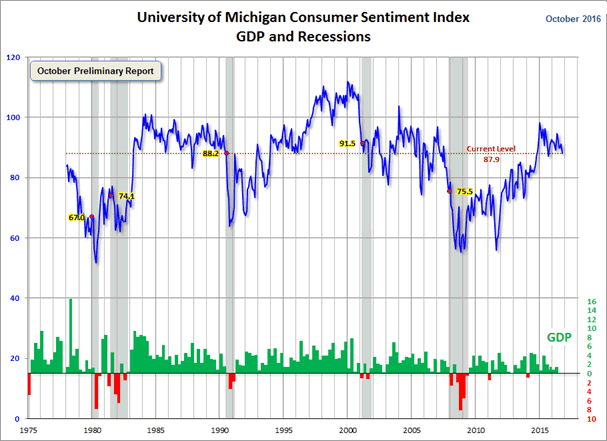
Michigan consumer sentiment slips to 87.9 in the October preliminary report. Jill Mislinski updates the story and the terrific Doug Short chart combining multiple elements of the story in a single look.
Q3 GDP estimates have started to fall....
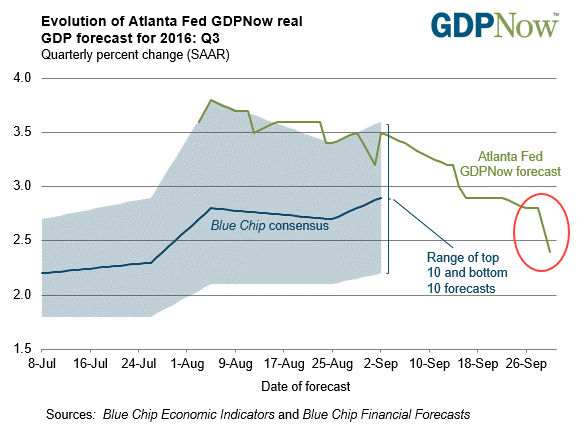
Q3 GDP estimates edge lower as more data is reported. Calculated Risk summarizes the move from various sources. One example above in the chart.
Market Rotation
A key trend emerging from ETF analysis has shown that financials are rising while utilities have started to fall. Could this be an early sign of a year end rally? Utilities which are yield assets are considered safer bets while financials and banks form the riskier bets.
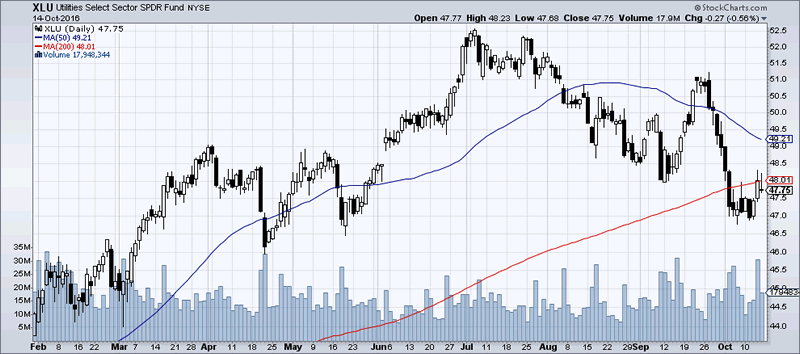
The utilities ETF has corrected below th 200 DMA by over 9%.
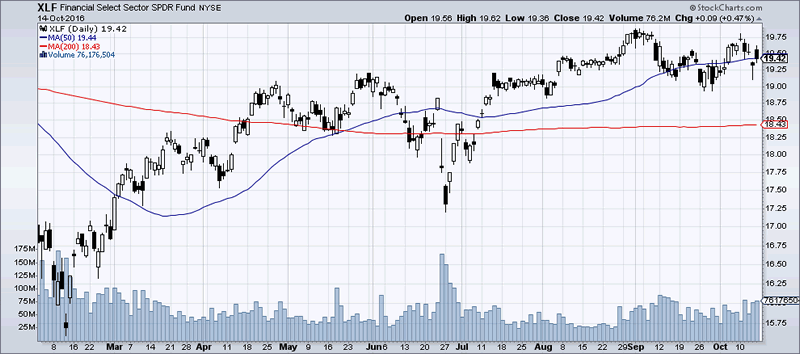
The financial ETF has marginaly risen. Markets are not very bearish risk stocks.
Conclusion
The economy is a mixed bag as you can see from various the data points. While jobs data has improved but the rate of improvement has slowed dramatically. Over 1 million jobs are needed just to match the peaks of 2007. Consumer sentiment has been weakening. Early estimate of GDP has fallen. But against this backdrop, we have improving earning data and potential market rotation that could be materializing.
JM is the partner at FXMesh. Over 15 years of trading, hedge fund and research experince background, he now provides investment advice and economic reasearch to clients around the world from his site http://fxmesh.com
He has worked at some of the most marquee names in trading and hedge fund industry. He invented the MESH Framework of trading. He will also like publish regular free articles at marketoracle for benefit of the readers.
Copyright 2016 John Mesh. All rights reserved.
Disclaimer: The above information is not intended as investment advice. Market timers can and do make mistakes. The above analysis is believed to be reliable, but we cannot be responsible for losses should they occur as a result of using this information. This article is intended for educational purposes only. Past performance is never a guarantee of future performance.
© 2005-2022 http://www.MarketOracle.co.uk - The Market Oracle is a FREE Daily Financial Markets Analysis & Forecasting online publication.