


NFP, Wikileaks, falling momentum, slipping real estate…recipe for correction?
Stock-Markets / Financial Markets 2016 Oct 10, 2016 - 01:10 PM GMTBy: John_Mesh

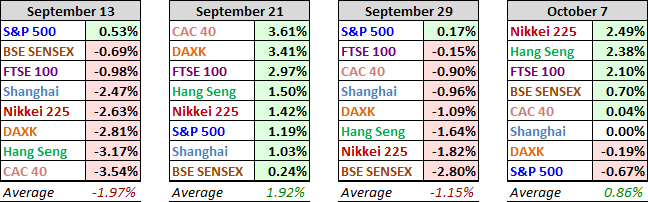
 The rally in equities resumed for the UK's FTSE and three of the four Eastern indexes on our world watch list (the Shanghai Composite spent the week on holiday celebrating Chinese National Day). Japan's Nikkei was the top week-over-week performer, up 2.49% with Hong Kong's Hang Seng close behind at 2.38%. The US's S&P 500 was the laggard, down 0.67%, which snapped a three-week advance.
The last four weeks
The tables below provide a concise overview of performance comparisons over the past four weeks for these eight major indexes. We've also included the average for each week so that we can evaluate the performance of a specific index relative to the overall mean and better understand weekly volatility. The colors for each index name help us visualize the comparative performance over time.
Market Summary
The S&P 500 hit its 0.24% intraday high in the opening seconds and sold off in a couple of waves to its -0.74% intraday low shortly before the lunch hour. An early afternoon bounce trimmed the loss, and the index closed with 0.33% loss. The 500's -0.67% loss for the week snapped a three-week rally. The yield on the 10-year note closed down two BPs at 1.73%. The snapshot of past five sessions in the S&P 500 is above.
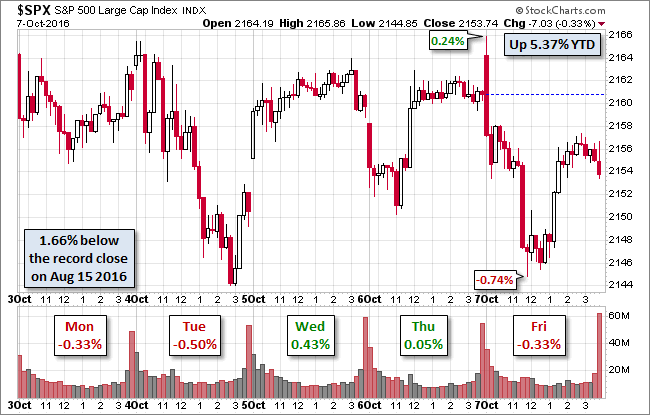
Here is daily chart of the index. Despite the jobs-report drama, trading volume was unremarkable. The market's focus will no doubt shift back to the approaching presidential election.
NFP Charts
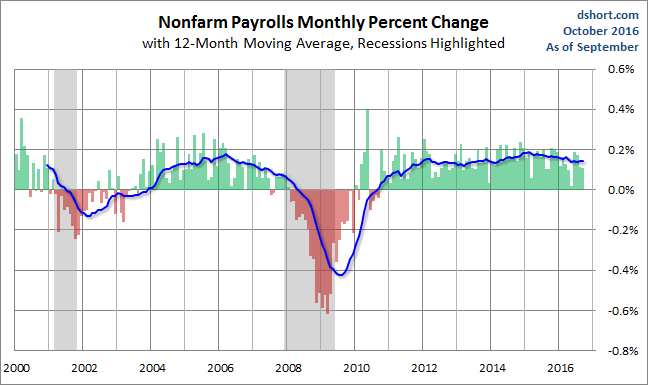
Above is a snapshot of the monthly percent change in Nonfarm Employment since 2000. The blue line is the 12 month moving average siggesting the long term average.
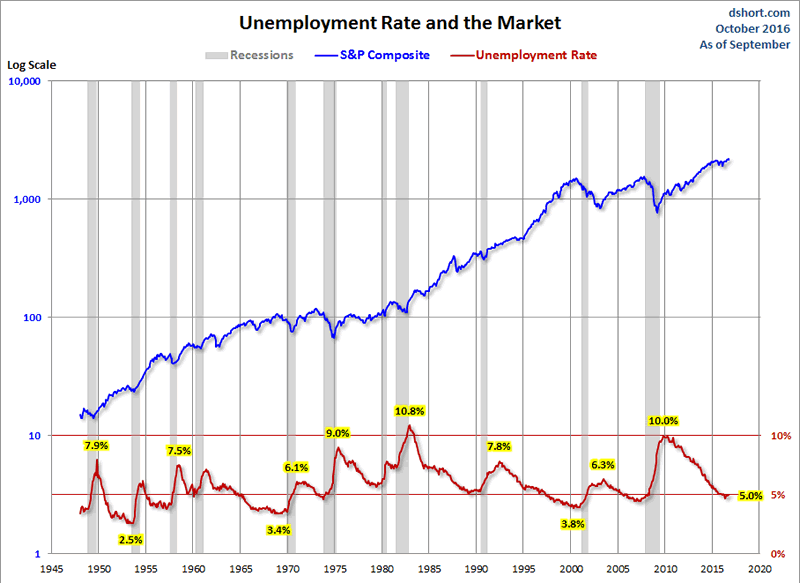
The unemployment peak for the current cycle was 10.0% in October 2009. The chart above shows the pattern of unemployment, recessions and the S&P Composite since 1948. Unemployment is usually a lagging indicator that moves inversely with equity prices (top series in the chart). Note the increasing peaks in unemployment in 1971, 1975 and 1982. The mirror relationship appears to be repeating itself with the most recent and previous bear markets.
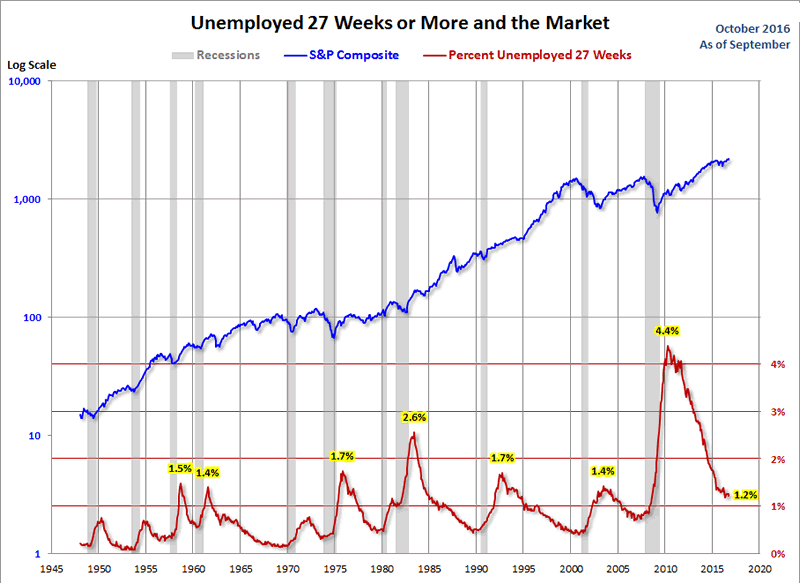
The chart shows the unemployment rate for the civilian population unemployed 27 weeks and over. This rate has fallen significantly since its 4.4% all-time peak in April 2010. It is now at 1.2%, down from 1.3% the previous month.
The New York Stock Exchange publishes end-of-month data for margin debt on the NYX data website, where we can also find historical data back to 1959. Let's examine the numbers and study the relationship between margin debt and the market, using the S&P 500 as the surrogate for the latter. The first chart shows the two series in real terms — adjusted for inflation to today's dollar using the Consumer Price Index as the deflator. At the 1995 start date, we were well into the Boomer Bull Market that began in 1982 and approaching the start of the Tech Bubble that shaped investor sentiment during the second half of the decade. The astonishing surge in leverage in late 1999 peaked in March 2000, the same month that the S&P 500 hit its all-time daily high, although the highest monthly close for that year was five months later in August. A similar surge began in 2006, peaking in July 2007, three months before the market peak. Debt hit a trough in February 2009, a month before the March market bottom. It then began another major cycle of increase.
The Latest Margin Data
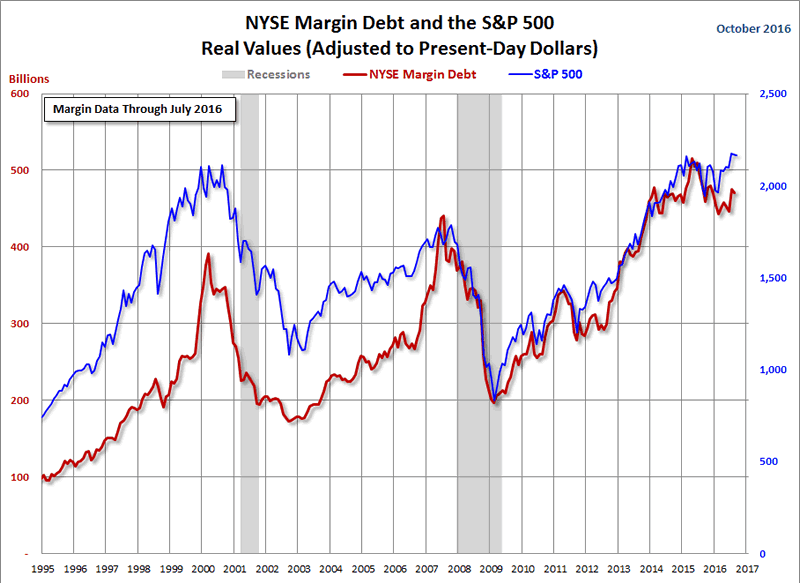
The latest debt level is down a fractional 0.7% month-over-month after last month's 6.1%, which was the largest MoM increase in 15 months. The current level is 7.1% below its record high set in April of last year.After the market low of 2009, margin debt again went on a tear until the contraction in late spring of 2010. The summer doldrums promptly ended when Chairman Bernanke hinted of more quantitative easing in his August, 2010 Jackson Hole speech. The appetite for margin instantly returned, and the Fed periodically increased the easing. With QE now history, margin debt is off its record high. The key question, of course, is whether that April 2015 peak was a Fed-induced, easy-money bubble and the precursor to a major market decline as in 2000 and 2008. Meanwhile, the equity market remains in high gear, as evidenced by the S&P 500 having logged three record closes in August. As this posting, the index is only 1.4% below its latest record close. current level is well off its record close in April of last year and showing a pattern similar to what we saw following the market peaks in 2000 and 2008. This has been an interesting indicator to watch in recent months and will certainly continue to bear close watching in the months ahead.
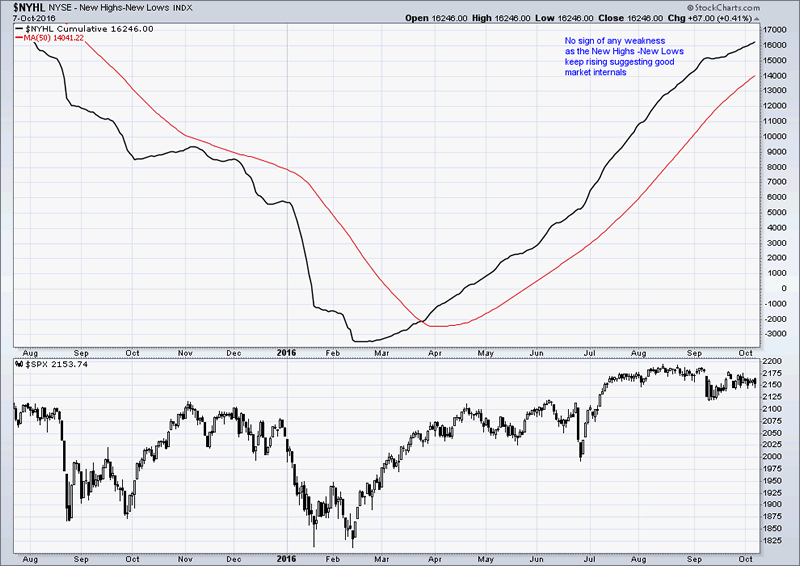
The new high new low line is marching higher for S&P500 index. This is continued bullishness.
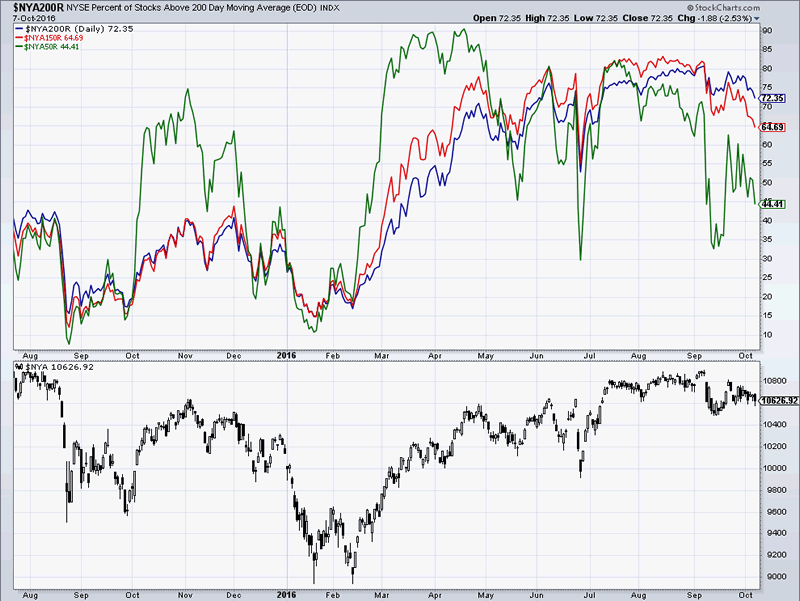
The percent of stocks above the 50 DMA has fallen sharply to 44%. Also the percent above 150 and 200 DMA are also falling.
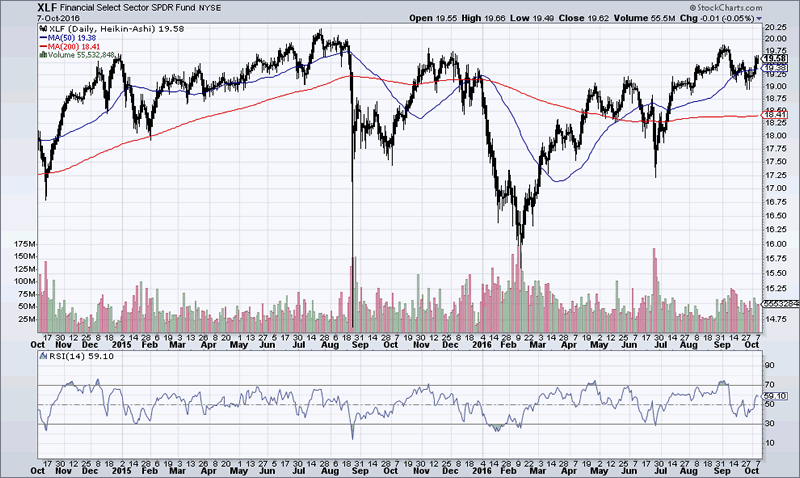
The performance of the financial ETF has given comfort to the bulls. Even as Deutsche Bank is struggling, market is oblivious and pushes the high beta Financial sector ETF to new highs.
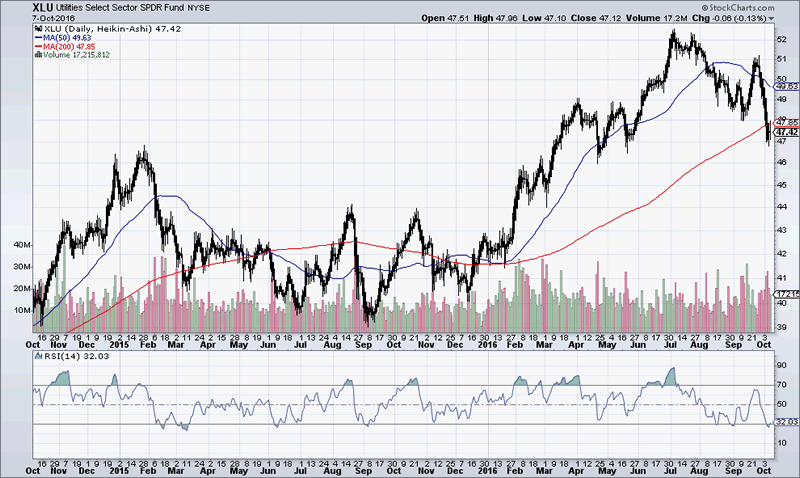
The utitlities sector has fallen below the 200 DMA on high volumes. However, we believe this could be a goog buying oppotunity with risks of a major market correction looming.
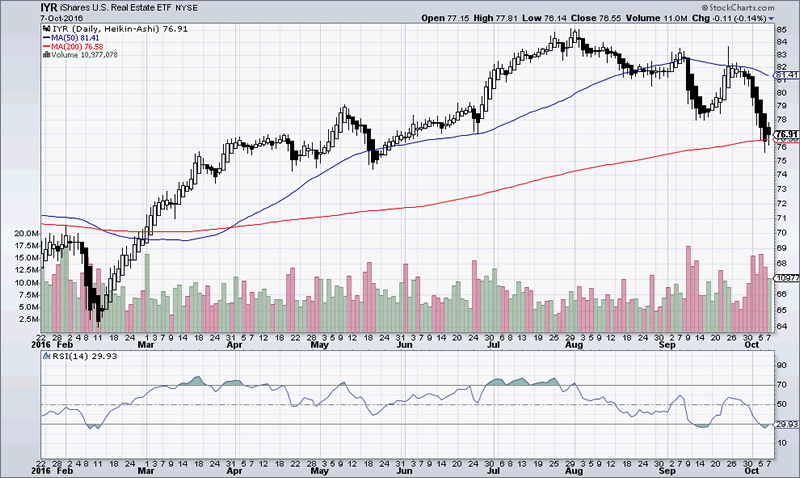
The real estate IYR is falling for the third month. The volumes have been high as shown. But it is now oversold on the daily and hence could be ripe for some consolidation or minor bounces.
From Dodge Data & Analytics:
Dodge Momentum Index Stumbles in September
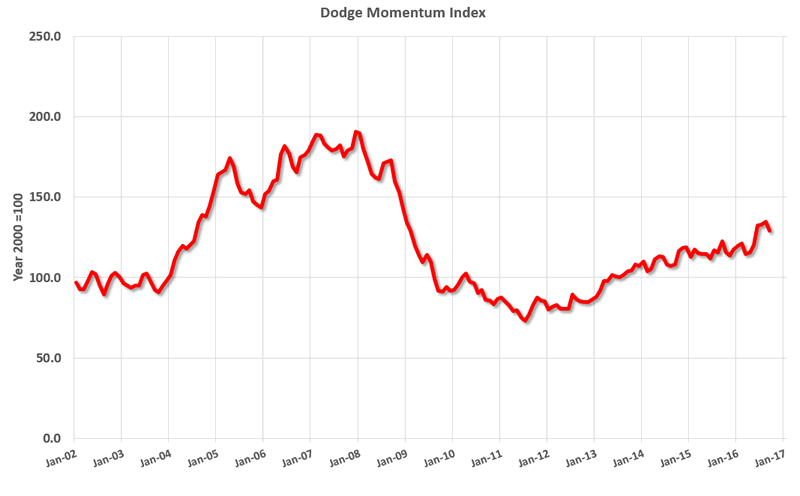
The Dodge Momentum Index fell 4.3% in September to 129.0 from its revised August reading of 134.8 (2000=100). The Momentum Index is a monthly measure of the first (or initial) report for nonresidential building projects in planning, which have been shown to lead construction spending for nonresidential buildings by a full year. The decline in September was the result of a 5.3% drop in institutional planning and a 3.6% decrease in commercial planning, retreating from the strong performance in August which benefitted from an influx of large projects ($100 million +) into planning. September’s decline follows five consecutive months of gains for the Momentum Index, and resumes for now the saw-tooth pattern that’s often been present in the data since 2014. Even with the recent volatility on a month-to-month basis, the Momentum Index continues to trend higher, signaling that developers have moved plans forward despite economic and political uncertainty. With the September release the Momentum Index is 5.1% higher than one year ago. The institutional component is 5.4% above its September 2015 reading, while the commercial component is up 4.9% emphasis added
This graph shows the Dodge Momentum Index since 2002. The index was at 129.0 in September, down from 134.8 in August. According to Dodge, this index leads "construction spending for nonresidential buildings by a full year". In general, this suggests further increases in CRE spending over the next year.
Final Thoughts:
Financial markets are in limbo. There is enough fundamental drivers to support the market. Yet the technicals do not yet inspire confidence. We do not believe, that the markets have enough reason to crash. However the weak technicals cannot be ignored.
JM is the partner at FXMesh. Over 15 years of trading, hedge fund and research experince background, he now provides investment advice and economic reasearch to clients around the world from his site http://fxmesh.com
He has worked at some of the most marquee names in trading and hedge fund industry. He invented the MESH Framework of trading. He will also like publish regular free articles at marketoracle for benefit of the readers.
Copyright 2016 John Mesh. All rights reserved.
Disclaimer: The above information is not intended as investment advice. Market timers can and do make mistakes. The above analysis is believed to be reliable, but we cannot be responsible for losses should they occur as a result of using this information. This article is intended for educational purposes only. Past performance is never a guarantee of future performance.
© 2005-2022 http://www.MarketOracle.co.uk - The Market Oracle is a FREE Daily Financial Markets Analysis & Forecasting online publication.