US Housing Market Bubble II – It’s Happening Again!
Housing-Market / US Housing Oct 09, 2016 - 05:12 PM GMTBy: Andy_Sutton
 This will be a bit different of a piece because we are not reporting on something that has already happened; we’re dealing with something that is ongoing and developing. Graham will handle roughly the first half of the article, then Andy will handle the second. Please bear with us as we try to break this editorial into two distinct pieces. You’ll understand as you read it why we chose to handle this in such a fashion.
Since everything in the blogosphere goes by what is officially declared by who, so forth, and so on, ditto, ditto, etc, etc, we are officially declaring there is yet ANOTHER bubble – this one in housing. Again. Perhaps ‘still’ is the proper word rather than ‘again since the first one never really was totally washed out of the system. As an addendum to our very well-received ‘American Economics’ piece, we’ll add a corollary: binges are good, purges are not to be tolerated unless absolutely necessary. If a purge becomes necessary, it will be only enough to give the Proletariat the idea that the problem is actually gone. A purge will never last longer than is absolutely necessary since that might affect consumer spending and the consumetariat’s voracious appetite for debt and financial self-mutilation.
David Lereah, former Chief Economist for NAR, had this publication on speed dial in the days leading up to his dismissal. He’d trot out some baloney line and he’d get stomped – deservedly so. He must have been a busy guy because we know there were lots of people calling his bluff on the rosy housing market. Well, the NAR is at it again. It is still somewhat early in the process in America, but there are definite signs. We want to get on record early. And to preface our content this time around we will say unequivocally that the 2008 financial crisis was not the fault of people paying too much for homes. 2008 was a largely contrived event, meant to partially purge the system and allow for a reset along with concomitant consolidation of wealth (stock market), but leaving plenty of room at the bottom for a re-inflation at a later date.
The anatomy of 2008 is so similar to that of the Great Depression that it cannot be ignored. This was a Greater Depression, but of course the government numbers were fudged to make it not look so bad after all. The fudging was global. This is all theater, people. It is amazing how Americans have an easy time seeing the troubles in Europe and vice versa. The Europeans are the most well-versed people I have ever run across – when it comes to the problems in other people’s backyards. However, neither group is good at seeing its own issues.
I (Graham) have the unique advantage of being US-born and raised (still a citizen) while working in Europe for nearly a decade so I know quite a bit about both cultures. I model what economies and markets are likely to do given certain sets of circumstances. Then I plug in variables. Wildcards if you will, then see what kinds of reactions and changes occur. Andy, on the other hand is US-born, has never been to Europe, but he is probably the most observant person I know. He’s a humble companion and says little, but he’s a trained scientist with multiple US medical certifications and licenses to practice, and worked in cutting edge biomedical research environments before attaining an MBA with honors in Econ. He’s taught at various levels. He’s a trained observer, a student of the scientific method, and is absolutely lethal when it comes to accuracy. He’s a bit more conservative than I am in that he refuses to place time constraints on events. I see his point and we agree to disagree, but I’ve found that people seem to operate better when given a time component constraint. However, I fully understand the dilemma of crying wolf and I try to hedge my remarks regarding time. When you see time constraints provided in this publication, they are mine, not his.
None of this is meant to toot our horns. We get nothing from this other than the satisfaction of helping our fellow man. I bring these points out about our experiences to give you perspective regarding the type of information you’re getting. We’re not always right, despite our collective skills, but we smell a bubble brewing in real estate and so chronicle it we will.
Graham’s Musings
One of the main sources I like to use in doing housing research is The Global Property Guide. It is run out of the Philippines and sports some very comprehensive research and commentary. One of my former responsibilities was to analyze the housing markets in several countries around the globe. I think the tilt is a bit on the rosy side, but the numbers have borne out with independent research I’ve done on my own. For this analysis I’ll be using GPG and ‘official’ US housing numbers from the FHA and the Census Bureau.
The site breaks the world down into logical subunits. For our purposes today, we’ll be looking at North America. The headline article in that section is titled “How much longer can the US housing market grow at this amazing rate?” The subtitle talks about a voracious demand for housing, the eagerness of people to buy houses, and the increase in residential construction activity. The subtitle also points out that prices are rising rapidly as well. Let me quote some statistics, most of which are from the US Census Bureau, then make a few remarks on those numbers.
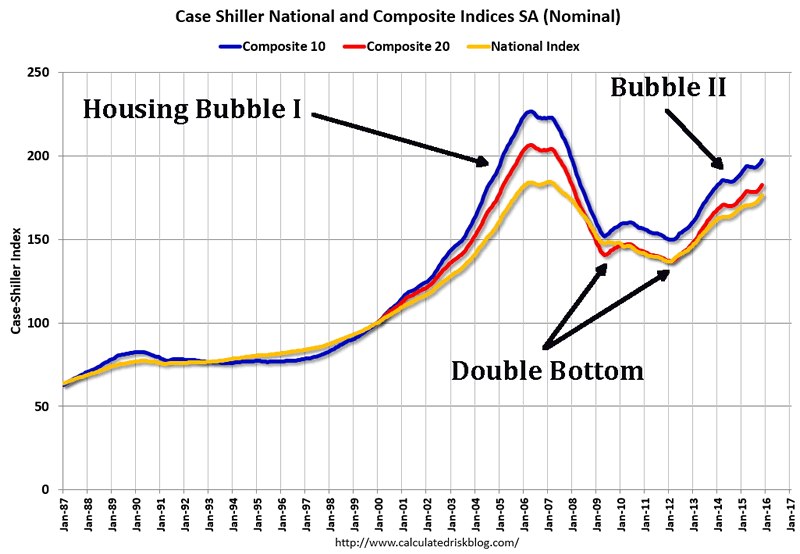
Above you can look at the Case-Shiller Index for housing in America. The Composite 10 is the top 10 markets by size, the Composite 20 is the 20 largest by size, and the National Index is the whole country. As you can easily see, there was a ramp-up that started in 2000, right around the beginning of the dotcom blowout. So as one bubble was bursting, another was starting. However, the growth was fairly tame until around 2004 and then you’ll notice the change in slope to being more steep. The Index actually topped right in the beginning of 2006 with the largest markets seeing an almost immediate reversal. The 2008 crisis, blame for which was pinned on the housing market, didn’t take place for another two and a half years.
January 2009 and 2012 were something of a double bottom after a very weak attempt to rally in between with the 2012 bottom being notably lower than that of 2009. But notice that even though there was a double bottom, the index never even got close to returning to the pre-2000 ‘baseline’. This failure to return to the baseline is important. It tells us that either there has been a structural change of some sort or that the bubble never fully deflated. Then we see a steady increase in the CS index through the present. This brings to mind a couple of questions, then we’ll get to some of the Census Bureau’s statistics:
1 - Who is buying all these houses?
2 - Mortgage rates have been in the cellar for years now, even when the bubble was unwinding. Why the resurgence in home buying? It certainly isn’t because of a sudden drop in rates.
3 - Note that the National portion of the composite ran significantly lower than the Top 10 Composite in the run-up to 2006, but is much closer now. Is it possible there is some publication bias involved where the various reporters aren’t reporting all their negative results?
During the period to April 2016, the CS seasonally adjusted home price index increased 5.3% (3.3 in real terms, using the government’s CPI joke as a deflator). The previous year period (to April 2015), the increase was 4.3% (no real value given). The FHA’s measure of home prices rose 5.9% in the period to April 2016 (4.6% real – a bigger joke of a CPI deflator).
The most active markets in terms of price increases were Portland (12.32%), Seattle (10.67%), Denver (9.45%), Dallas (8.65%), San Francisco (7.77%), Tampa Bay (also 7.77%), Atlanta (6.51%), Miami (6.44%), and San Diego (6.34%).
The California numbers get immediate attention just because of the fact that businesses and people are allegedly leaving the state in a mass exodus thanks to Jerry Brown and his insane legislature. This immediately calls in question #1 – who is buying all these houses in California to drive up prices at a rate that is nearly 6X that of the government’s cooked inflation metric?
The chart below is a Fannie Mae survey and represents potential homebuyers’ views on rates. In our anecdotal conversations with people looking for homes, rates are almost never mentioned. What is mentioned is the monthly payment, taxes, and whether or not there will be enough money leftover after the transaction to put in all the toys and accoutrements of the American lifestyle. Almost all of the people we’ve talked to are looking to borrow well in excess of the amount necessary to purchase the house so as to have funds leftover for additions, remodeling, etc. Mortgage salesmen have gone the route of used car salesmen. They focus on the bottom line. “What can you afford a month?” and work backwards from there. Let’s look at the expectations of potential homebuyers, then at what the banks are doing to grease the skids.
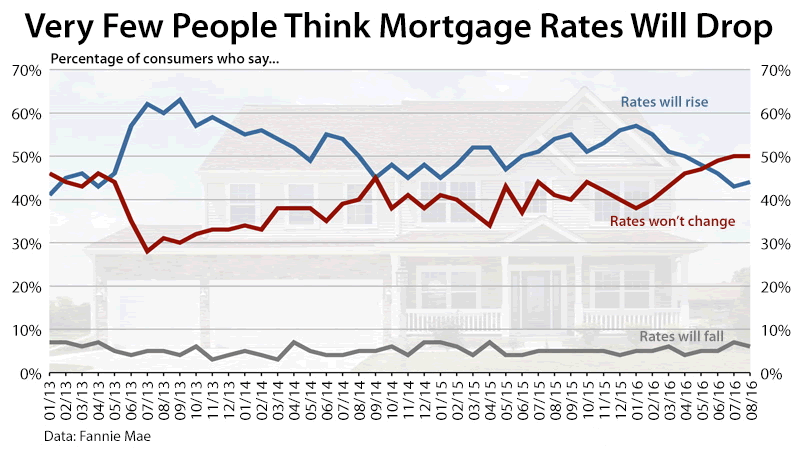
People surveyed feel there is little chance of rates dropping so they might as well purchase now. However, still nearly half of those surveyed think rates will rise, and although that number is dropping of late, it is still significant. If they expect rates to raise, then now is the time to buy, right? The ones who feel rates won’t change fall into the ‘If I get a good deal, why not?’ category. The banks are quick to assist too. Take a look at the percentage of banks who are easing standards (again) to encourage more foolish behavior:
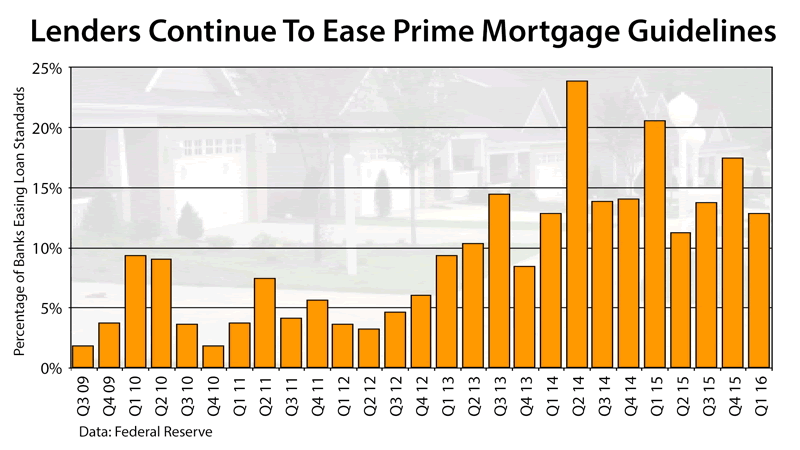
It’s not an overwhelming percentage yet, but as I said earlier, the bubble is in the earlier stages. By the time it ends, I’d expect to see half or more of banks easing standards to suck as many in as possible. We know wage growth is tepid at best. Home prices are rising and even with the low rates, payments are increasing. Property taxes are increasing nationwide. The aforementioned source doesn’t list trends, but you can look at your own statements from the past decade and decide where the trend is going. The bottom line is housing is becoming more expensive, wages are stagnant, and we’ve got the makings of a bubble being pumped up by a population that is already strung out on credit. My prediction is that this bubble won’t be as large in magnitude, but it will do more damage because people went into this one in comparatively worse shape than the last one 12 years ago.
Andy’s Notes:
The distinct disadvantage of having the last say in anything is that the person who goes first gets to make all the good points and Graham has outdone himself once again. Keep in mind we are only scratching the surface here.
One thing definitely worth noting is that this is (again) not strictly an American housing bubble. Believe it or not, according to the Global Property Guide, prices in Canada are booming, Germany is up as are many other countries in the crisis-ridden EU. This should not be much of a surprise, however, since debt doesn’t really bother anyone anymore. Again, that is not just an American phenomenon either. We want, therefore we borrow.
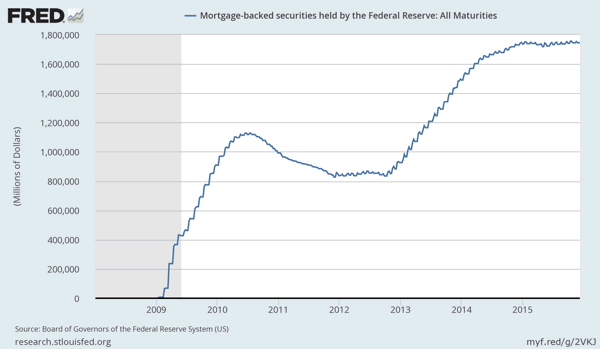
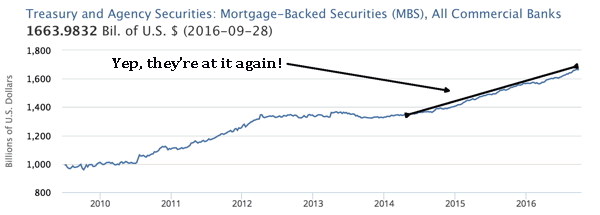
Note the chart above. We see the huge spike after the 2008 financial crisis really got going. Prior to 2009, the not-so-USFed owned almost nothing in the way of mortgage-backed securities. Around the middle of 2010, the central bank got rid of some of those MBS. Whether they were sold back into the markets or simply moved into another Maiden Lane, LLC is another discussion. The point is since 2013, the not-so-USFed bumped up its purchase programs again, increasing the total holdings of MBS roughly 50% over the 2010 high. We can see there is still some purchasing going on, but what is even more interesting than the central bank are the commercial banks that it supports and works for. Their activities regarding MBS have been a demonstration of outright arrogance. “We did it once, we failed, you bailed”. “We’ll do it again if we want and when we fail again, you’ll bail again – and you’ll like it”. That’s the general idea here.
This is where the Deutsche Bank (DB) situation comes into play and the interconnectedness of all these financial whorehouses for that matter. The banks that hold these securities want to buy insurance in case the bubble goes ‘pop’ again thanks to people not being able to pay their mortgages. So they buy credit default swaps from other banks who then become known as the counterparty in that particular transaction. So, say Bank ‘A’ holds $50 billion of MBS. They buy credit default swaps (insurance) on that $50 billion from Deutsche Bank. Meanwhile, DB is selling insurance to all manner of other banks and holding a lot of these instruments themselves and DB is buying insurance on its holdings from other banks. Follow? So you end up with a giant web. See below. The answer to the question regarding a problem with MBS is ‘probably not’. Yet. When we see delinquencies and foreclosures start to nose up, then we’ll be looking out for problems with securitized mortgages.
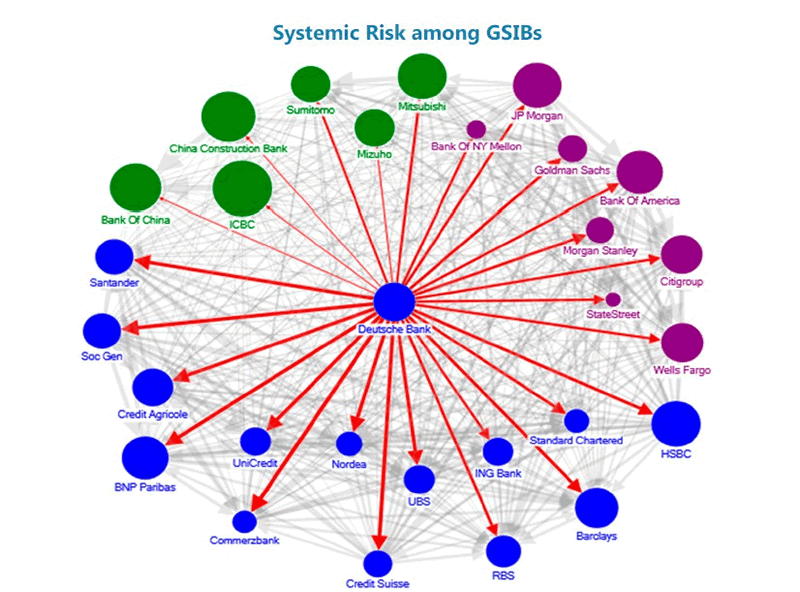
The picture above illustrates the reach of Deutsche Bank, particularly if it fails. You could draw a thousand iterations of the above graphic putting every other bank at the center and showing how it would impact its counterparties as well.
So the immediate question becomes: “Is there a mortgage-backed securities problem?”. The problems arise when there are defaults and the holders of the MBS don’t get the money they’re supposed to because people aren’t paying their mortgages. This is part of what drove the situation back in 2007-2009, but it is not safe to assume that it will be the same driver as last time. The other part was the ‘insurance’ in the form of credit default swaps. A bunch of banks wrote a lot of ‘insurance policies’, to use industry parlance, and what happened was akin to an auto insurer insuring a lot of cars and everyone crashed in the same month. The banks who issued the insurance figured they’d never have to pay out on more than a few percent of the ‘policies’ they’d written.
When the numbers came in many orders of magnitude higher than that, we heard the USCongress start talking about bailouts. Henry Paulson made his threats and the Congress gave three quarters of a trillion dollars to Paulson – who ended up giving it to his Wall Street buddies. No, I am not making this up. Click the links and read for yourself. Make sure to read the ENTIRE Rolling Stone article. Paulson’s antics and the massive lie of the $700B TARP program don’t come out until several paragraphs in.
It is important to review what happened because it is very likely to happen again at some point. The bubble is being blown back up again, fueled in part by low interest rates coupled with a good dose of what seems to be permanent anterograde amnesia on the part of homebuyers.
In this part of the country, modern residential development-situated housing used to sell for around $100/sqft (pre-Bubble I), give or take a few bucks depending on various factors. A brief review of recent transactions shows prices averaging $141/sqft. This isn’t what the sellers are asking for; this is what is being paid by buyers. And the buyers are doing it happily. They’ve bought the baloney that ‘rates are low, buy while you still can’.
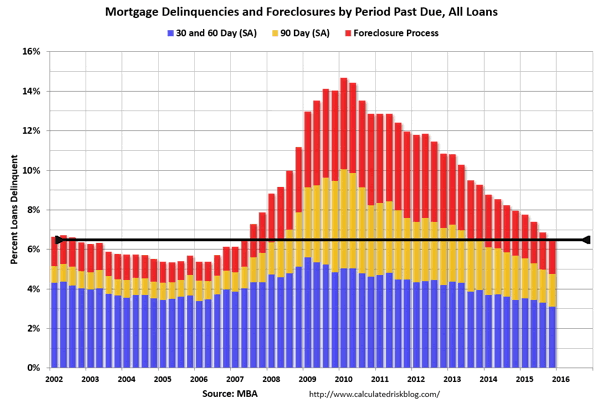
As we said in the opening, this bubble is in its early stages. The chart above demonstrates that delinquency conditions up to the foreclosure process are right around where they were about mid-2007. Keep in mind that these levels in mid-2007 didn’t even cause anyone to raise an eyebrow except for those of us who saw the problem developing.
The situation is actually worse now. There are fewer people working. Wages are stagnant. Monetary and price inflation have eroded the wages people do make. Debt levels across the board are higher at the consumer level. The last installment gave a brief look into America’s credit card problem. We can see, according to Bloomberg, that mortgage borrowing bounced off the mat and is now growing again after a pretty significant contraction after the last bubble burst.
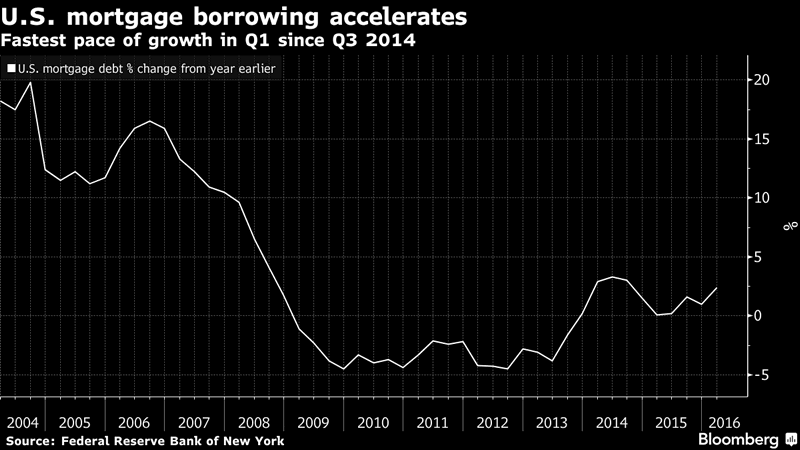
Not only has the rate of borrowing increased on a percentage basis, the total amount of mortgage debt outstanding has bottomed out and begun to increase as well.
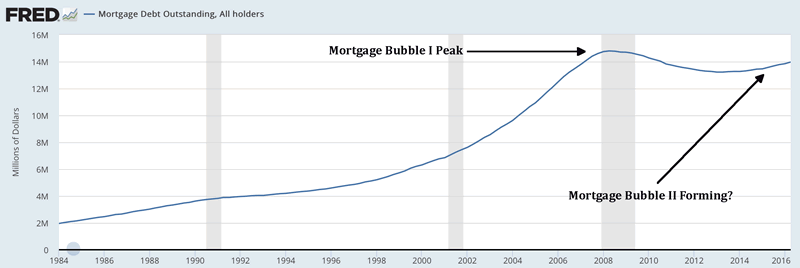
Doing a quick analysis of the above graphic, we first note that peak debt outstanding in 2008 was around $15 ‘million million’ as labeled by the chart. We translate that into $15 trillion in mortgage debt outstanding. More than GDP in 2008 ($14.6 trillion), and far exceeding the national debt in 2008 (~9.25 trillion). It is worth noting that the national debt has more than doubled since the financial crisis started and now stands at $19.5 trillion. All you Keynesians out there can take a long walk off a short pier; yours is no way to run an economy.
Conclusions
Getting back to the chart above, mortgage debt outstanding bottomed out during 2013 and has been on the rise ever since, weighing in at just over $14 trillion today. The ‘bottom’ was around $13 trillion. Putting it into percentages, total mortgage debt outstanding has increased around 8% since the ‘bottom’ in 2013. When you consider that from 2000-2008, the figure went from a little over $6 trillion to over $15 trillion, 8 percent might not seem like much. However, when you consider all the other kinds of debt and how they’ve absolutely exploded, we opine that there isn’t enough ammo in the system to drive total mortgage debt up by a factor of 1.5 again. If that would happen, we’d be in a full-blown hyperinflationary event.
It doesn’t seem that many have gotten the memo though. Houses are being thrown up and purchased like it was 2005 all over again. We’re not at the bubblemania stage yet, but we strongly feel it is not far around the corner. Even if it isn’t as dramatic as the first one, coupled with the total debt in the system, it will not be a pretty ending for anyone. We close with one last graphic: auto loans. Just to give you a taste of what is going on with some of the other forms of debt out there.
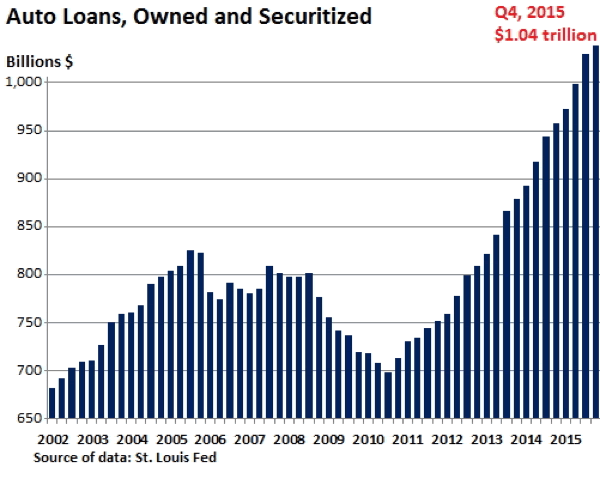
A 33% percent increase in automobile debt outstanding over the past 6 years is definitely noteworthy and probably indicative of a car bubble, albeit very small in magnitude compared to housing. After all, we’re only talking about one trillion dollars here, not 10, 15, or even 20. It is amazing how perspective becomes skewed as these numbers all continue to accelerate along their rather precise mathematical functions. Welcome to the 7th inning stretch of a fiat monetary system.
Graham Mehl is a pseudonym. He currently works for a hedge fund and is responsible for economic forecasting and modeling. He has a graduate degree with honors from The Wharton School of the University of Pennsylvania among his educational achievements. Prior to his current position, he served as an economic research associate for a G7 central bank.
By Andy Sutton
http://www.andysutton.com
Andy Sutton is the former Chief Market Strategist for Sutton & Associates. While no longer involved in the investment community, Andy continues to perform his own research and acts as a freelance writer, publishing occasional ‘My Two Cents’ articles. Andy also maintains a blog called ‘Extemporania’ at http://www.andysutton.com/blog.
Andy Sutton Archive |
© 2005-2022 http://www.MarketOracle.co.uk - The Market Oracle is a FREE Daily Financial Markets Analysis & Forecasting online publication.


