


Will the Stocks Bull Market Remain Intact in 2017?
Stock-Markets / Stock Markets 2016 Oct 06, 2016 - 10:34 AM GMTBy: Clif_Droke

 The question confronting investors right now is whether the lateral trading range in the major indices represents consolidation of the long-term uptrend, which precedes an eventual upside breakout from the range? Or does it represent distribution (i.e. selling) which precedes an eventual breakdown of the trend?
Bulls and bears have assembled evidence to support their respective take on this conundrum, but the most basic and useful evidence suggests the first outcome, namely an eventual upside resolution. Let’s examine the evidence in support of this conclusion.
While the bears have correctly observed that in the previous instances when the major indices have bumped up against trading range resistance – or temporarily exceeded it – the market has always had a sharp decline. It’s also true that during the sideways range-bound market of 2015 there was definite evidence that distribution was taking place among informed investors. This preceded the July-August collapse last year and the secondary collapse in January-February of this year.
All through the spring and summer of 2015 the list of stocks making new 52-week lows on the NYSE was growing. It remained elevated well above 40 – the dividing line between a healthy and unhealthy market – for much of the year. Anytime there is a stretch of several consecutive days where new lows are above 40 while new lows are shrinking it strongly implies internal selling pressure beneath the surface of the broad market. This was one indication that distribution was taking place last year while the Dow and S&P were churning in a sideways trend. Finally, after several months of this internal selling pressure the market broke under the weight of it, as can be seen in the following graph.
After bottoming in February the stock market has only seen a total of nine days where the new 52-week lows numbered 40 or above. That’s an impressive stretch of internal health and it shows that there has been little or no selling urgency or distribution since then. The dearth of new lows argues strongly, therefore, in favor of the longer-term bullish trend remaining intact heading into 2017.
On a short-term basis, however, there has been a definite loss of momentum. As we’ve reviewed in recent reports the NYSE short-term directional components of our Hi-Lo Momentum (HILMO) index keep deteriorating. Here’s what the three components look like as of this writing on Wednesday. The blue line is the short-term directional indicator, the red line is the momentum bias, and the green line is the internal trend.
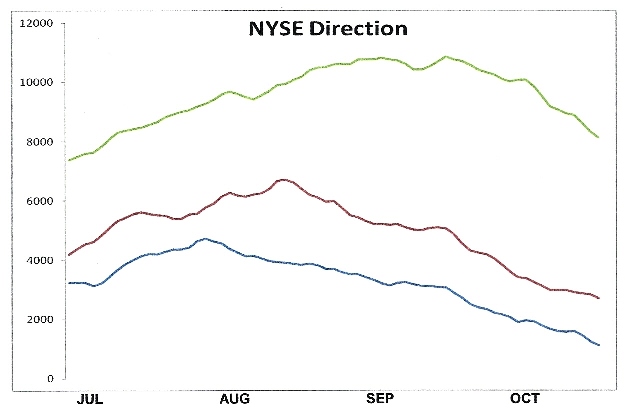
The downward-slanted trend in the above graph is indicative of a loss of forward momentum on a near-term basis and explains why the major indices have been unable to rally in sustained fashion since peaking in August. As long as the short-term momentum indicators are declining it will also mean the market is vulnerable to negative news and may at some point experience another pullback.
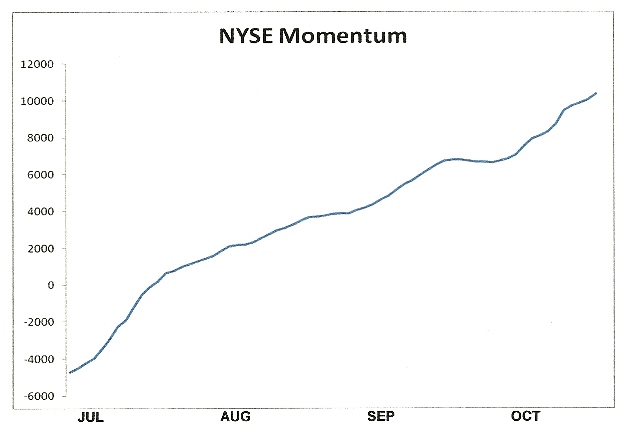
Acting as a counterbalance against this short-term downward pressure is the longer-term internal momentum indicator, shown below. Currently this is the only one of the eight major HILMO components that is rising on a sustained basis. My interpretation of this graph is that as long as this indicator continues its nearly vertical climb it should act as a deterrent to a serious bear raid. That has certainly been the case since July-August when the internal cross-currents first became evident. It’s also why any attempt at short selling among the bears has ultimately backfired due to the strongly rising longer-term momentum current reflected in this indicator.
So while the loss of short-term internal momentum may negatively impact the near-term trend, it shouldn’t prove fatal to the major uptrend that began in March-April 2009.
Mastering Moving Averages
The moving average is one of the most versatile of all trading tools and should be a part of every investor's arsenal. Far more than a simple trend line, it's also a dynamic momentum indicator as well as a means of identifying support and resistance across variable time frames. It can also be used in place of an overbought/oversold oscillator when used in relationship to the price of the stock or ETF you're trading in.
In my latest book, Mastering Moving Averages, I remove the mystique behind stock and ETF trading and reveal a simple and reliable system that allows retail traders to profit from both up and down moves in the market. The trading techniques discussed in the book have been carefully calibrated to match today's fast-moving and sometimes volatile market environment. If you're interested in moving average trading techniques, you'll want to read this book.
Order today and receive an autographed copy along with a copy of the book, The Best Strategies for Momentum Traders. Your order also includes a FREE 1-month trial subscription to the Momentum Strategies Report newsletter: http://www.clifdroke.com/books/masteringma.html
By Clif Droke
www.clifdroke.com
Clif Droke is the editor of the daily Gold & Silver Stock Report. Published daily since 2002, the report provides forecasts and analysis of the leading gold, silver, uranium and energy stocks from a short-term technical standpoint. He is also the author of numerous books, including 'How to Read Chart Patterns for Greater Profits.' For more information visit www.clifdroke.com
Clif Droke Archive |
© 2005-2022 http://www.MarketOracle.co.uk - The Market Oracle is a FREE Daily Financial Markets Analysis & Forecasting online publication.