


Stock Market Correction to Worsen?
Stock-Markets / Stock Markets 2016 Oct 03, 2016 - 08:58 AM GMTBy: Andre_Gratian

Current Position of the Market
SPX Long-term trend: The long-term trend is up but weakening. Potential final phase of bull market.
SPX Intermediate trend: The uptrend from 1810 continues, but it has entered a corrective phase which could extend into November.
Analysis of the short-term trend is done on a daily basis with the help of hourly charts. It is an important adjunct to the analysis of daily and weekly charts which discuss longer market trends.
Daily market analysis of the short term trend is reserved for subscribers. If you would like to sign up for a FREE 4-week trial period of daily comments, please let me know at anvi1962@cableone.net
Correction to Worsen?
Market Overview
So far, the correction has been relatively mild with the initial drop bottoming immediately, rallying, and then entering a narrow but volatile trading range. This could be about to change. The DJIA is getting relatively weaker than SPX, and this is always a warning sign. Also, I’ve been waiting for IWM to start showing some distribution after reaching its intermediate P&F projection of 125. QQQ is slightly behind but appears to have met its target of 119 as well. In general, the various indexes that we follow are all showing weakening weekly MACD patterns.
DJIA has also recently made some forays outside of its trend line from the February low, closing outside of it twice, but being rescued by a general market rally. You know what they say about the third time! SPX is a little farther away from its trend line, but if it trades below its recent low, it will also break the trend line. Should this happen, it will convince us that the bears are getting more aggressive.
The daily chart patterns of the SPX and DJIA are visibly rounding over and starting down and this process could not only continue but accelerate into mid-November when the 20-wk cycle makes its low. If the P&F distribution pattern is any indication, we could be 100 to 150 points lower by then.
Analysis (This chart and others below, are courtesy of QCharts.com.)
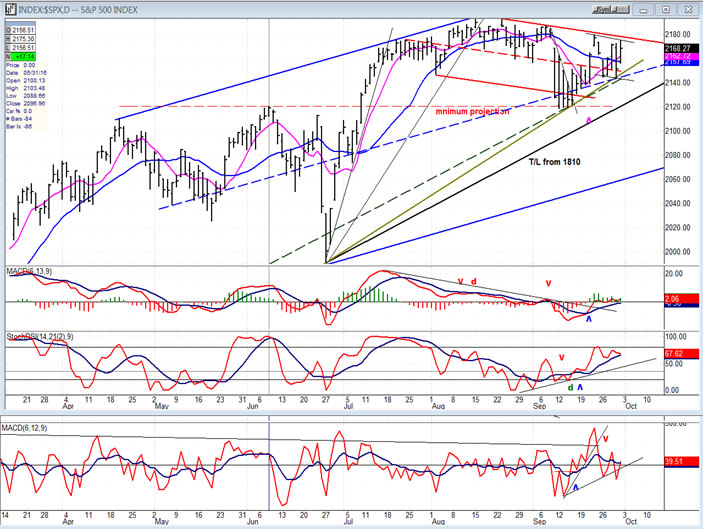
Daily chart
The first decline after the distribution phase stopped after retracing approximately .382 of the uptrend from 1992 and finding good support at the level of the previous tops. However, in the process it did break below the minor low of 2147 and started a lower low, lower high pattern which is contained in the small declining channel at the top. If it does not rise above it soon, it is likely to break below the greenish trend line from 1992, and the dashed blue mid-channel line of an expanded blue channel. That would allow it to challenge the intermediate trend line from 1810, but if it does that, it’s safe to say that by then, the DJIA will already be trading below the same trend line and have started a steeper decline. Depending on how much more support SPX gets from the congestion level on the left, it could then continue its decline until it reaches the blue lower channel line.
The indicators look ready to turn down, which would continue the declining trend that the MACD started at its previous mid-July top and that it has not been able to reverse successfully since. The SRSI is very close to giving another sell signal, and the A/D indicator may already be in a declining pattern.
There is nothing bullish about the picture that the daily chart shows us. Rather, it looks more like the index is ready to accelerate its correction.
Hourly chart
The hourly chart shows more graphically how SPX has been struggling to maintain the uptrend generated by the FED when it announced that it would not raise interest rates at the September meeting. That rally was followed by a steep downtrend, and then another after a 3-day bounce. Another buying phase appears to have ended on Friday when heavy selling took place in the last 5 minutes of the session, shortly after the index had met another near-term projection from the base which was created at the 2120 level and discussed in the last letter. I had suggested then, that the rally could extend all the way to 2195; but this is becoming increasingly doubtful, even if the final high has not been made at 2175.
The short-term trend now seems to have been reduced to the lower portion of a black rising channel, and if the reversal which started late on Friday is not too severe, we could make one final attempt at reaching 2185 or 2195; the former also being a phase projection from the 2120 low, and the latter most likely being the most that can be derived from that base.
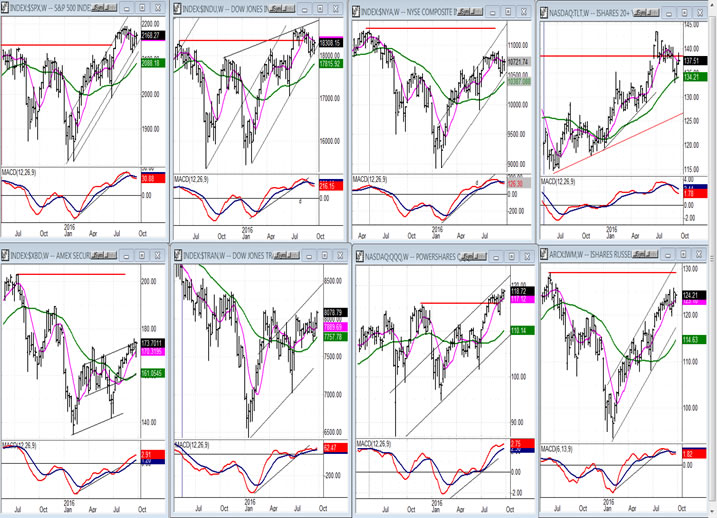
- Some leading & confirming indexes (Weekly charts)
- The charts of SPX and DJIA are side by side at the top left. It’s easy to see that the latter is in a steeper downtrend and, as mentioned earlier, that the trend line from February is slowly running out of supporting power. This is probably the index to watch as it is likely to be the canary for the next downtrend. The other main index in this group, the NYA (next on the right) is also showing signs of weakness a little more pronounced than in the SPX -- in addition to being not even close to having made a new high on this move. Three of the others are displaying even more long-term weakness, including IWM which is beginning to look toppy.
-
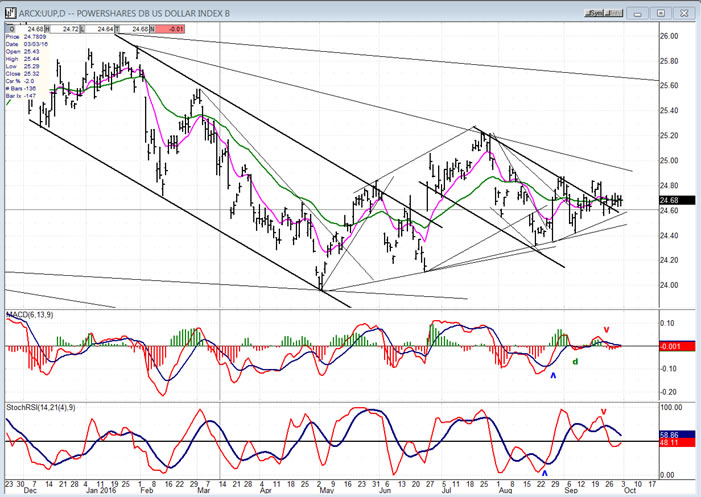
- UUP (dollar ETF)
- UUP has not been able to make headway and remains in a neutral position. However, it has broken outside of its downtrend line and, unless it starts to roll over, it should eventually favor more uptrend.
-
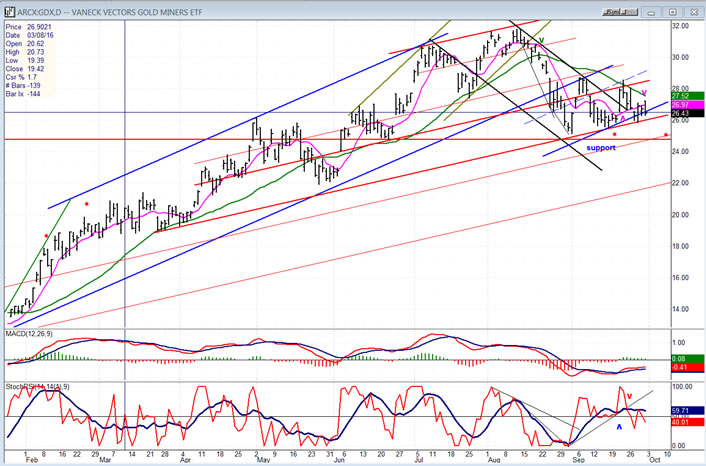
- GDX (Gold Miners ETF)
- GDX appears to be forming a triangle (which is a continuation pattern). A breakout on the downside would target about 21.5-22, while a measured move would take it all the way down to 18. There has been enough distribution on the P&F chart for a projection to both price levels.
-
- Note: GDX is now updated for subscribers several times throughout the day (along with SPX) on Marketurningpoints.com.
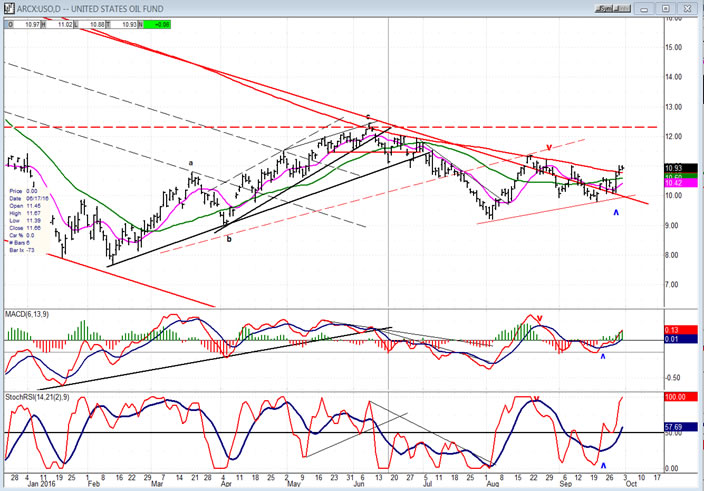
- USO (U.S. Oil Fund)
- USO has broken out of its long-term trend line, but even if this is the beginning of a short-term uptrend – as the indicators suggest – it is most likely part of a larger base building process. Securities which suffer this much long-term weakness seldom turn on a dime and start a new significant uptrend without first building a base which determines the extent of the next move. Odds are that USO will be confined to trading below 12.50-13.00 for some time.
-
Summary
While SPX has resisted entering into a more serious correction, there is evidence that, unless it can make a new high over the next week or so, the corrective pattern will become steeper as intermediate cycles drive prices lower over the next few weeks.
Andre
FREE TRIAL SUBSCRIPTION
If precision in market timing for all time framesis something that you find important, you should
Consider taking a trial subscription to my service. It is free, and you will have four weeks to evaluate its worth. It embodies many years of research with the eventual goal of understanding as perfectly as possible how the market functions. I believe that I have achieved this goal.
For a FREE 4-week trial, Send an email to: info@marketurningpoints.com
For further subscription options, payment plans, and for important general information, I encourage
you to visit my website at www.marketurningpoints.com. It contains summaries of my background, my
investment and trading strategies, and my unique method of intra-day communication with
subscribers. I have also started an archive of former newsletters so that you can not only evaluate past performance, but also be aware of the increasing accuracy of forecasts.
Disclaimer - The above comments about the financial markets are based purely on what I consider to be sound technical analysis principles uncompromised by fundamental considerations. They represent my own opinion and are not meant to be construed as trading or investment advice, but are offered as an analytical point of view which might be of interest to those who follow stock market cycles and technical analysis.
Andre Gratian Archive |
© 2005-2022 http://www.MarketOracle.co.uk - The Market Oracle is a FREE Daily Financial Markets Analysis & Forecasting online publication.