Could the OPEC deal set stage for the Next Stock Market Risk Rally?
Stock-Markets / Stock Markets 2016 Sep 29, 2016 - 12:34 PM GMTBy: John_Mesh
 We have been advising our clients about the market internals and fundamentals to be mildly bullish. Against popular opinion we have stuck to our guns that market will rally before the next big correction. The news of an OPEC deal could be the trigger if true. Reuters and other media outlets reported from Algeria on Thursday that OPEC members had agreed to cut oil output for the first time since 2008. Reuters reported OPEC members would limit production to a range of 32.5 million to 33 million barrels per day, down slightly on August's output of 33.2 million barrels a day, but there were few details availabe on the deal. Oil prices surged about 5 percent in response, with West Texas Intermediate trading at $46.75 per barrel. Without a deal, analysts had said oil could plunge to $40 or lower. ItThe OPEC deal to cut oil production may provide a short-term support for prices, but chances are it won't change the supply outlook much, Goldman Sachs said. Goldman said in a note to investors that it was sticking with its forecasts for WTI at $43 a barrel for the end of this year and $53 a barrel in 2017. The investment bank had cut its year-end forecast this week from $50 a barrel.
The S&P 500 bottomed at its -0.38% intraday low in the late morning, rose back to the flat line around 2 PM, as which point the oil news triggered a spurt higher. The OPEC news was an especially big deal for the energy sector. West Texas Intermediate Crude closed the session up a whopping 5.33%. The yield on the 10-year note closed at 1.57%, up one basis point from the previous close.
Snapshot for last 5 days
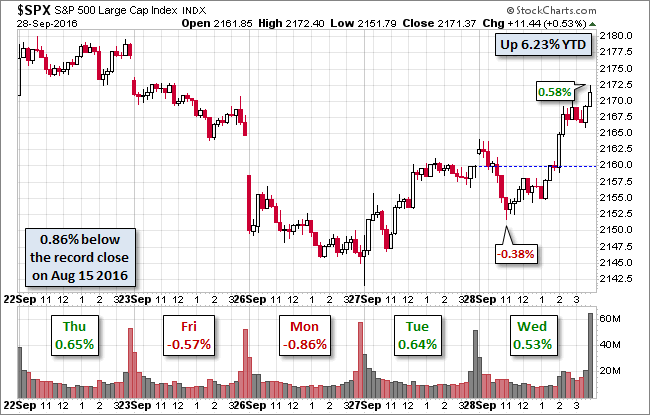
The index closed the session with a 0.53% gain, a bit off its 0.58% intraday high shortly before the final bell.
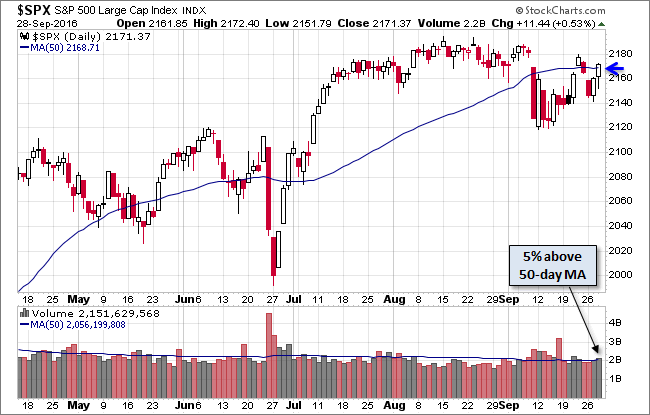
Trading volume ticked up slightly, and the index is now vack above its 50-day price moving average.
August Durable Goods: Steady in August
The Advance Report on Manufacturers’ Shipments, Inventories and Orders released today gives us a first look at the August durable goods numbers. Here is the Bureau's summary on new orders:
New orders for manufactured durable goods in August decreased $0.1 billion or virtually unchanged to $226.9 billion, the U.S. Census Bureau announced today. This decrease, down three of the last four months, followed a 3.6 percent July increase. Excluding transportation, new orders decreased 0.4 percent. Excluding defense, new orders decreased 1.0 percent. Electrical equipment, appliances, and components, down following two consecutive monthly increases, drove the decrease, $0.2 billion or 2.5 percent to $9.6 billion.
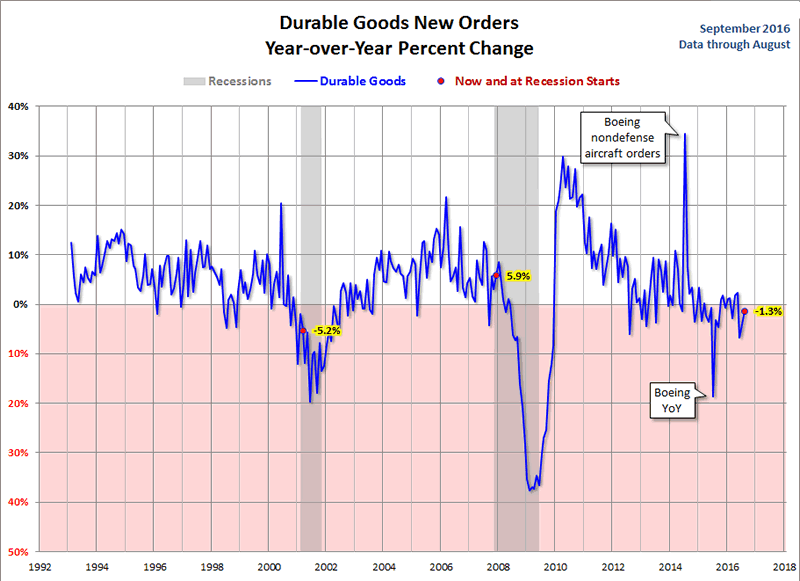
The latest new orders number at 0.0% (-0.04% to two decimal places) month-over-month (MoM) was above the Investing.com consensus of -1.4%. However, the series is down 1.3% year-over-year (YoY). If we exclude transportation, "core" durable goods came in at -0.4% MoM, which matched the Investing.com consensus.
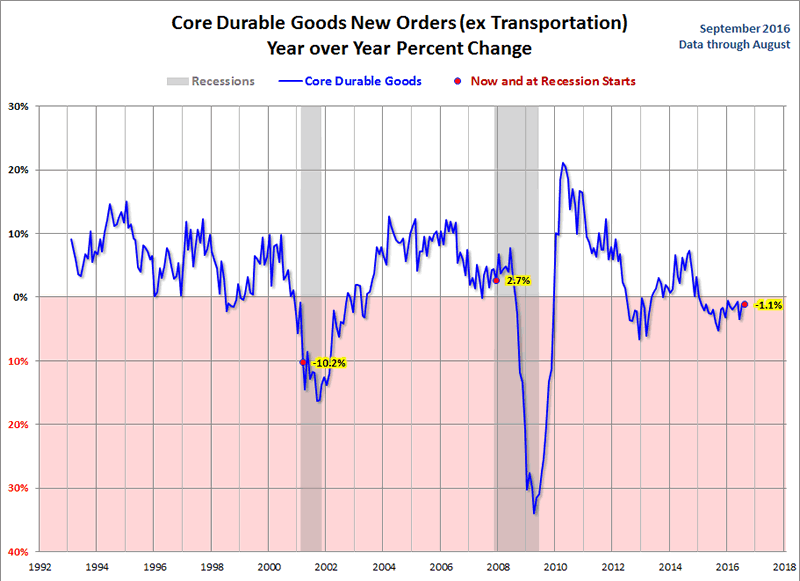
The core measure is down 1.1% YoY. If we exclude both transportation and defense for an even more fundamental "core", the latest number is down 1.8% MoM and down 3.7% YoY. Core Capital Goods New Orders (nondefense capital goods used in the production of goods or services, excluding aircraft) is an important gauge of business spending, often referred to as Core Capex. It posted a gain of 0.6% MoM but is down 3.1% YoY.
Market Internals and ETF Summary
Technology (XLK, +1.10%) and consumer discretionary (XLY, +1.02%) both enjoyed big gains on Tuesday as semiconductors ($DJUSSC) and recreational services ($DJUSRQ) paced those gains in each sector, respectively. It was an across the board advance as every industry group in those two sectors advanced except for automobiles ($DJUSAU) and publishing ($DJUSPB). The chart on the industrials sector is interesting, check it out:
NYSE Bullish index stays elevated
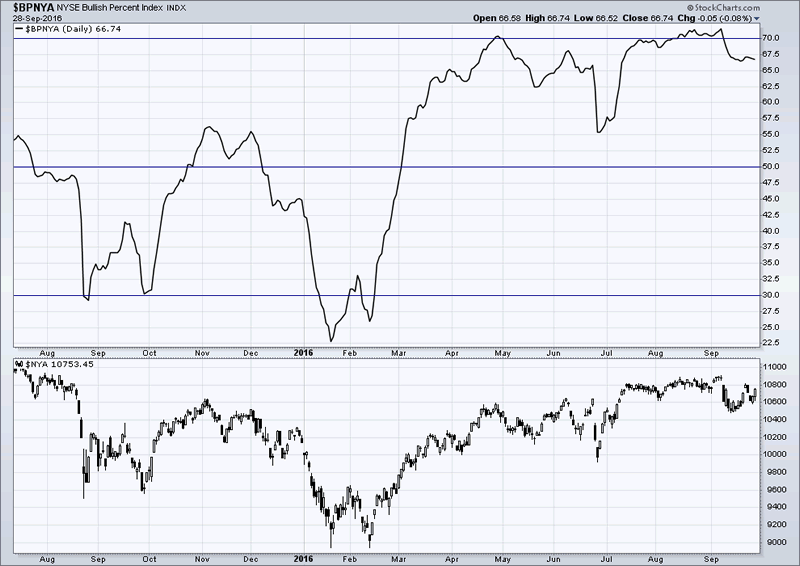
No sign of a major weakness as bullish percent stays elevated at 70%.

The bullish percent is 63% for stocks above 50 DMA. Percent of stocks above 100 and 200 DMA are also above 60. Thus markets internally show no signs of weakness yet.
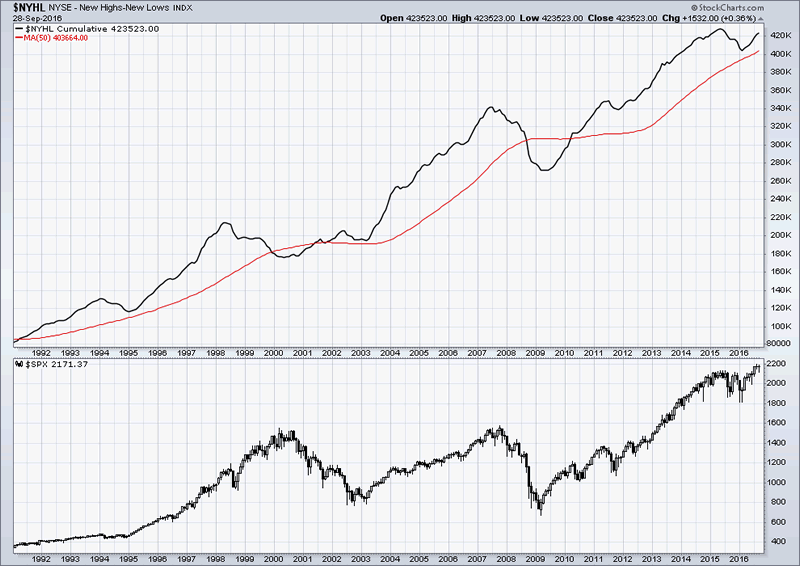
One of the most important market internals is the NYSE new high - new low line. This line has risen in 2016 and is pointing up. Market sentiment and money flows are geared to buy stocks. The broader market therefore will push higher in October 2016.
Final Thoughts:
All things considered, we have been weighing in the bullish side of the market and are fully invested. Not withstanding the risks in the global market and even considering the expansive valuation, we believe there is very little evidence of any waning of the bulllish sentiment. We think markets will proceed higher in october.
Trade Copier performance:
The MESH trade copier has closed over +850 pips with a 91% win rate. Interested clients can reach out to us at fx@fxmesh.com and als =o visit: Membership
JM is the partner at FXMesh. Over 15 years of trading, hedge fund and research experince background, he now provides investment advice and economic reasearch to clients around the world from his site http://fxmesh.com
He has worked at some of the most marquee names in trading and hedge fund industry. He invented the MESH Framework of trading. He will also like publish regular free articles at marketoracle for benefit of the readers.
Copyright 2016 John Mesh. All rights reserved.
Disclaimer: The above information is not intended as investment advice. Market timers can and do make mistakes. The above analysis is believed to be reliable, but we cannot be responsible for losses should they occur as a result of using this information. This article is intended for educational purposes only. Past performance is never a guarantee of future performance.
© 2005-2022 http://www.MarketOracle.co.uk - The Market Oracle is a FREE Daily Financial Markets Analysis & Forecasting online publication.


