


Stock Market New All Time Highs Next
Stock-Markets / Stock Markets 2016 Sep 26, 2016 - 12:16 PM GMTBy: Paul_Rejczak

 The week started at SPX 2139. The market rallied, after a gap up opening, to SPX 2154 on Monday. Then after the opening gap was closed on Monday the market finished unchanged. This sequence continued on Tuesday: gap up opening- close gap. On Wednesday another gap up opening-close gap sequence occurred, but during the FOMC statement/press conference the market rallied. The rallied continued to SPX 2180 on Thursday after another gap up opening, then pulled back to 2164 on Friday. For the week the SPX/DOW gained 1.4%, and the NDX/NAZ gained 1.4%. Economic reports for the week were sparse and mostly negative. On the downtick: housing starts, building permits, existing home sales, leading indicators and the Q3 GDP estimate. On the uptick: the NAHB, FHFA and weekly jobless claims improved. Next week’s reports will be highlighted by Q2 GDP, the PCE and the Chicago PMI. Best to your week!
LONG TERM: uptrend
Have recently come to realize there are quite a few EW counts floating around the blogosphere to define the advance from the SPX 1810 February low. We have been tracking four over the past few months, and have recently whittled it down to one with two alternates. The main count is a new bull market Primary III underway. The two alternates are basically two different views of the same irregular Primary B count. The count we eliminated is probably the most popular EW count: a Primary V underway. This count also has a few variables in the EW blogosphere. It is an interesting point in time for the stock market heading into a presidential election. New presidents seem to come along every eight years these days, instead of the customary four years. Bull markets also appear to last longer these days, than they were in the past. Connection?
Our quantitative OEW analysis suggests the bull market from 2009 ended in 2015, and it was the third longest bull market in the past 100 years. Only the 1921-1929 and 1987-2000 bull markets were longer. The bear market that followed, May 2015 – February 2016, was a bit short in time and percentage of decline. There are, however, several other quantified bear markets that were similar. One that immediately comes to mind took only six months while the market lost 17% of its value in 1984.
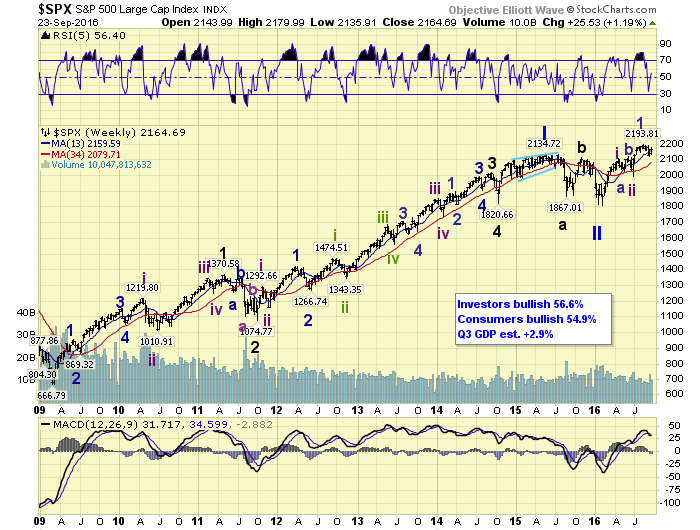
This week we updated the SPX weekly chart to display the preferred count, and moved the alternate count(s) to the NYSE daily charts. Since the NYSE has a similar 2016 pattern as the SPX, displaying the counts there appeared to be a good fit. Counting the February low as the end of the Primary wave II bear market, we have a Primary III bull market underway. The Primary I bull market lasted from 2009-2015. Since Primary III should last a number of years, Primary I was 6 years, we started off with labeling the first uptrend (1810-2111) as Intermediate wave i of Major wave 1. Then after an irregular Intermediate wave ii (2026-2121-1992) we have a shorter uptrend to 2194, and have labeled that Minor 1 of Intermediate wave iii. At this point it is much too early to speculate whether or not the next bear market will be at the end of Primary III, or the end of just Major wave 1 of Primary III. However it unfolds, we are currently expecting SPX 3000+ in the next 2 to 4 years.
MEDIUM TERM: uptrend an 80%+ probability
The last uptrend, which is labeled Minor 1, was five waves from SPX 1992-2194 (or 2188). From SPX 2194 a leading diagonal A to 2157, a B to 2188, then an ending diagonal C to 2120 could be counted. From SPX 2188 a simple, and short, A-B-C (2119-2163-2120) can be counted. Either way it appears the downtrend ended at SPX 2119/2120, as the NDX/NAZ have already confirmed new uptrends and have made new all time highs. Also, based upon a recent finding by one of our members Patrick M., there is a 80%+ probability that an uptrend is underway.
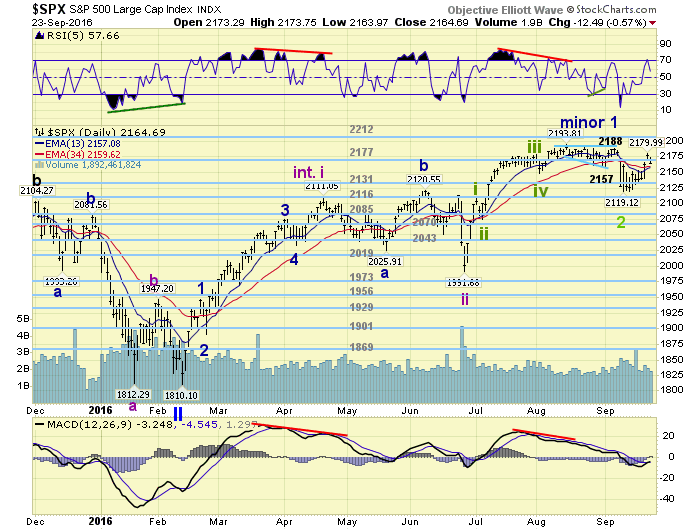
At the downtrend low the technicals, daily and weekly RSI/MACD, looked similar to the recent downtrend lows during this bull market. The daily RSI was quite oversold, and the MACD was negative. The weekly RSI was near oversold, just like the Br-exit downtrend low. The advance from the SPX 2119/2120 low has been a bit odd. There was first a rally to SPX 2151, then a pullback to 2131. After that there were three gap up openings that were completely closed before the latest rally from SPX 2140-2180. Will cover what this could mean in wave terms below. Medium term support is at the 2131 and 2116 pivots, with resistance at the 2177 and 2212 pivots.
SHORT TERM
After the apparent downtrend low at SPX 2120 the market had several overlapping rallies. The last three of the four rallies were created by gap up openings, that were completely sold off. Clearly there was a lot of positioning ahead of the FED’s FOMC statement on Wednesday.
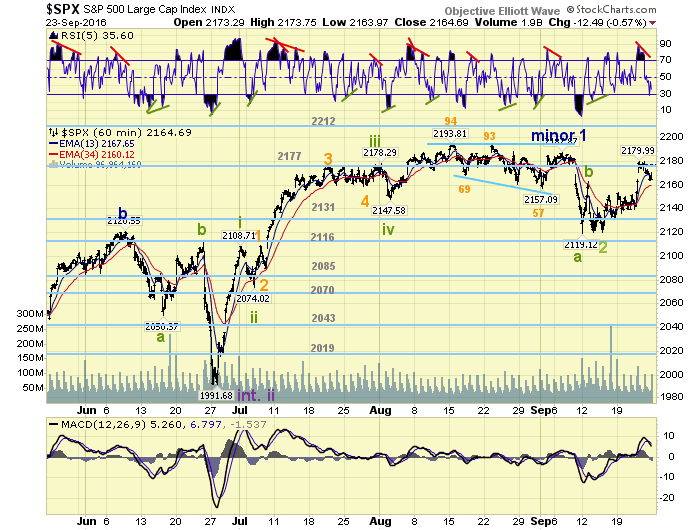
Thus far we have the following sequence from SPX 2120: 2151-2131-2154-2136-2151-2139-2152-2140, then 2180-2164. What this suggests is that there are a series of nested 1-2’s ending at SPX 2140. Then either the third wave, or part of, ending at SPX 2180. We will track this sequence to see how it unfolds in the coming weeks. For now, the current pullback could dip to around SPX 2160 before resuming the rally. Pullbacks of 15-20 points were fairly common during the last uptrend. Short term support is the at 2131 and 2116 pivots, with resistance at the 2177 pivot and SPX 2194. Short term momentum ended the week oversold. Best to your trading!
FOREIGN MARKETS
Asian markets were all higher on the week gaining 1.6%.
European markets were also all higher gaining 2.7%.
The Commodity equity group were also higher gaining 3.1%.
The DJ World index gained 2.2%.
COMMODITIES
Bonds continue to downtrend but ended the week flat.
Crude is trying to uptrend and gained 2.0%.
Gold is also trying to uptrend and gained 2.4%.
The USD is still in a downtrend and lost 0.7%.
NEXT WEEK
Monday: new home sales at 10am. Tuesday: Case-Shiller and consumer confidence. Wednesday: durable goods orders. Thursday: weekly jobless claims, Q2 GDP (est. +1.3%), and pending home sales. Friday: personal income/spending, the PCE, Chicago PMI and consumer sentiment. It is also FED speak week. Monday: governor Tarullo at 11:45. Tuesday: vice chair Fischer. Wednesday: testimony from chair Yellen. Thursday: governor Powell and chair Yellen both have speeches. Could be another day traders week. Best to your weekend and week!
CHARTS: http://stockcharts.com/public/1269446/tenpp
After about 40 years of investing in the markets one learns that the markets are constantly changing, not only in price, but in what drives the markets. In the 1960s, the Nifty Fifty were the leaders of the stock market. In the 1970s, stock selection using Technical Analysis was important, as the market stayed with a trading range for the entire decade. In the 1980s, the market finally broke out of it doldrums, as the DOW broke through 1100 in 1982, and launched the greatest bull market on record.
Sharing is an important aspect of a life. Over 100 people have joined our group, from all walks of life, covering twenty three countries across the globe. It's been the most fun I have ever had in the market. Sharing uncommon knowledge, with investors. In hope of aiding them in finding their financial independence.
Copyright © 2016 Tony Caldaro - All Rights Reserved Disclaimer: The above is a matter of opinion provided for general information purposes only and is not intended as investment advice. Information and analysis above are derived from sources and utilising methods believed to be reliable, but we cannot accept responsibility for any losses you may incur as a result of this analysis. Individuals should consult with their personal financial advisors.
Tony Caldaro Archive |
© 2005-2022 http://www.MarketOracle.co.uk - The Market Oracle is a FREE Daily Financial Markets Analysis & Forecasting online publication.