


Nasdaq NDX 100 Big Cap Tech Breakout ?
Stock-Markets / Tech Stocks Sep 23, 2016 - 12:26 PM GMT

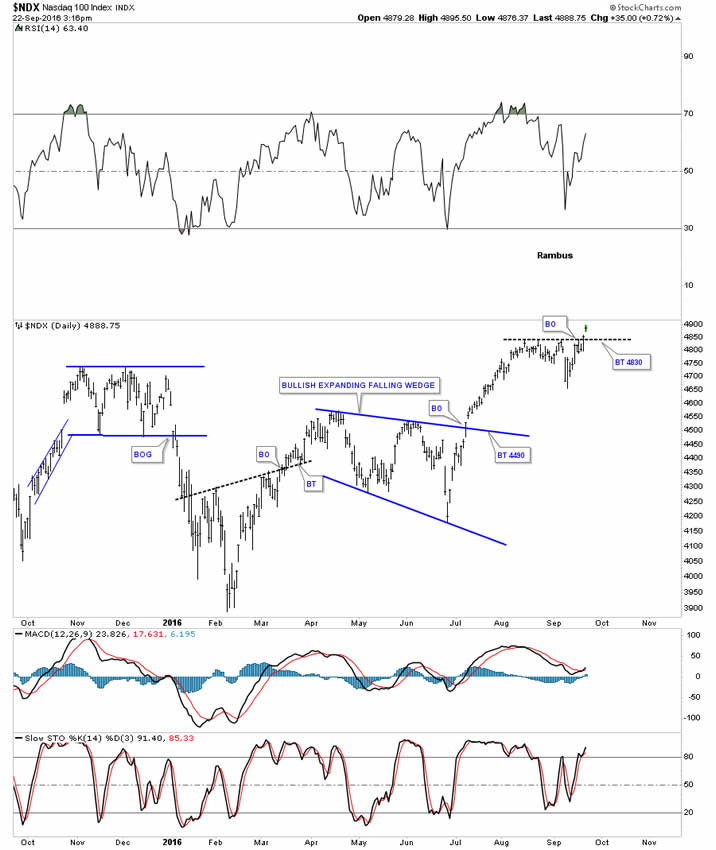
 Below is a daily chart which shows the NDX 100 big cap tech stock index trading at a new all time high today.
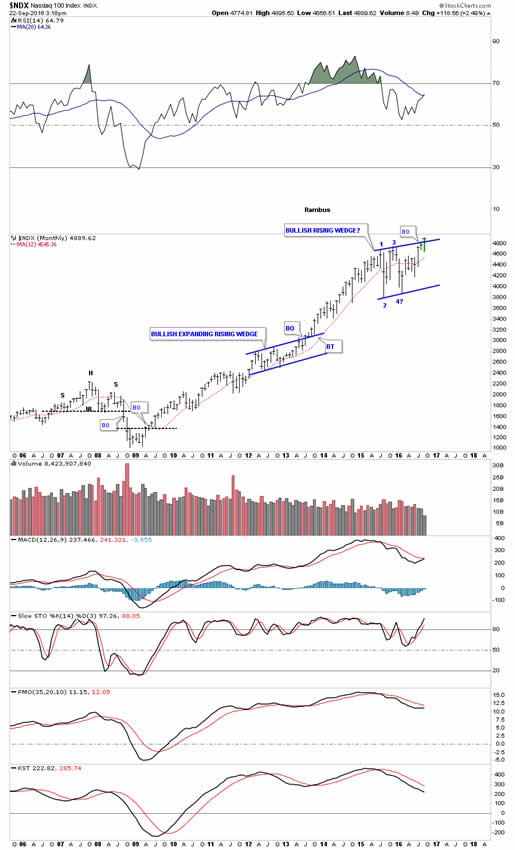
The breakout on the monthly chart.
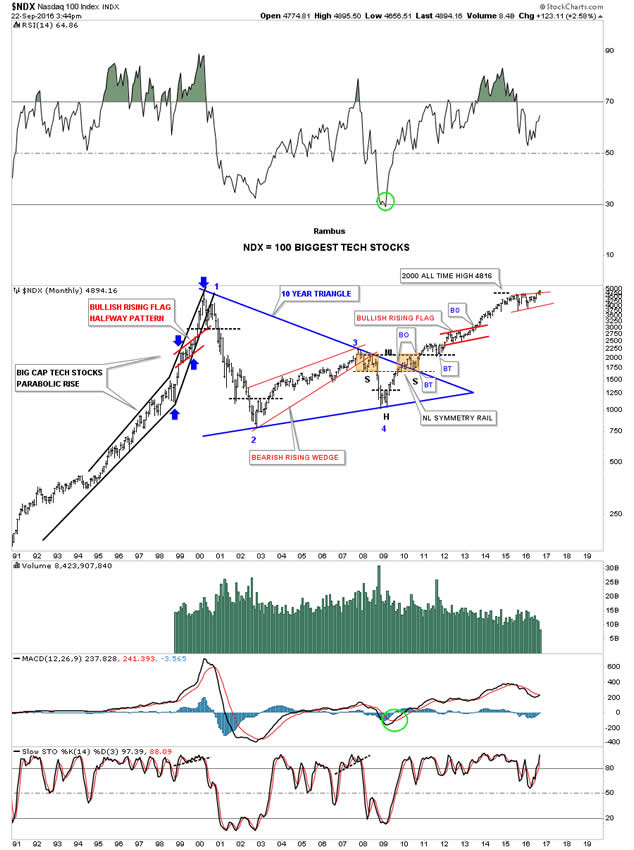
Before I discovered the junior PM stocks in 2002 the big cap tech stocks is where I played especially during the 1990’s. The real move for the tech stock actually began in 1995 where the final parabolic move started into the 2000 top. You can see the red bullish rising flag that gave me a very good clue to look for a top at a minimum or some type of consolidation pattern to start to building out. Things were extremely bullish back then and to be looking for a top was off most investors radar screens at that time. Luckily for me I got out close to the March high as suggested by the red bullish rising flag halfway pattern, measured by the blue arrows.
Once the price action broke below the horizontal black dashed line that marked the beginning of the bear market that would wipe out most investors that didn’t sell waiting for higher prices. That bear market also devastated many of the high flyers that never came back.
The NDX built out that red bearish rising wedge during its bull market run that ended in 2007 along with all the other stock markets. What was interesting in the crash that followed was the NDX made a higher low vs its 2002 bear market low whch many of the stock markets made a lower low. This was showing relative strength
That 2009 low ended up being the head of a very large symmetrical H&S bottom. The bull market that started in 2009 has run unabated for over seven years now and it looks like it’s getting ready for the next impulse move higher and is now trading at new all time highs. Most see a huge top but I see a consolidation pattern that is breaking out topside. Remember patterns that slope up into the direction of the main trend instead of against it, shows strength. Note the previous red bullish rising flag that formed in the uptrend.
During this latest consolidation period note how low the RSI has fallen back to almost the 50 area while the price action is making new all time highs. The energy is there for this big cap tech stock index to begin its next impulse move higher IMHO.
All the best
Gary (for Rambus Chartology)
FREE TRIAL - http://rambus1.com/?page_id=10
© 2016 Copyright Rambus- All Rights Reserved
Disclaimer: The above is a matter of opinion provided for general information purposes only and is not intended as investment advice. Information and analysis above are derived from sources and utilising methods believed to be reliable, but we cannot accept responsibility for any losses you may incur as a result of this analysis. Individuals should consult with their personal financial advisors.
© 2005-2022 http://www.MarketOracle.co.uk - The Market Oracle is a FREE Daily Financial Markets Analysis & Forecasting online publication.