


Has the Silver Bullet Run Out of Fire Power?
Currencies / Gold and Silver 2016 Sep 21, 2016 - 03:10 PM GMTBy: Nicholas_Kitonyi

 Commodity prices and especially those of precious metals have been impressive this year. The price of Gold and that of Silver have rallied significantly since the start of the year and the current indicators seem to point towards a continuous rally for the rest of 2016, albeit at a slower rate.
However, in the midst of it all, the price of Silver has emerged as the perfect compensation for those whom the market inflicted losses towards the end of last year as the US Federal reserve moved to hike interest rates.
The price of Silver is up 36% YTD, and this is after undergoing a major pullback over the last two months. In fact, at some point the shiny metal did hit 44% gain YTD and this implies that it could have easily been every commodity investors dream investment. Silver may not be as popular as Gold, but the yellow metal’s popularity has been dimmed with great effect by the performance of silver bar prices this year.
Currently, investors can buy an ounce of silver bars at price of about $19.25, and this is after including a spread of about 10 cents, as quoted on various silver bars trading platforms. However, as recent as June 1, 2016, an ounce of silver was going for about $16.00, and in early July, the price had already shot past $20.00 an ounce. That’s a massive payday for any investor who masterfully predicted the movement.
As for those whom the “bullet shot” movement passed without notice, it appears as though that bullet has now run out of power with the price of silver seemingly coming to terms with the realities of the market. As any optimistic commodities investor would say, it could be a good time to cling on to the silver bullet before it takes off for the next flight.
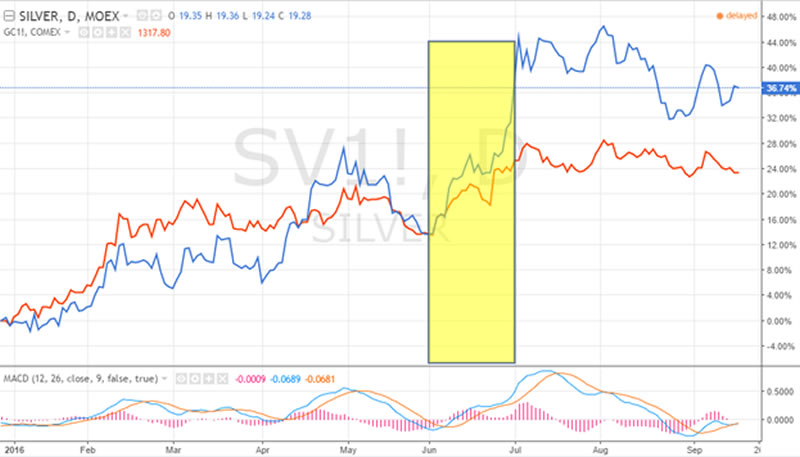
As demonstrated in the chart below, it is pretty clear that the price of silver appears to have taken the foot off the gas for the last couple of months with smaller movements either direction of the price. This shows that it could be awhile before we witness another rally similar to what happened in June.
Even after weak US Jobs Data was announced early this month, the sharp upward movement was short-lived with the price falling back to within the current levels of about $19.20 to $19.25 in just a few days.
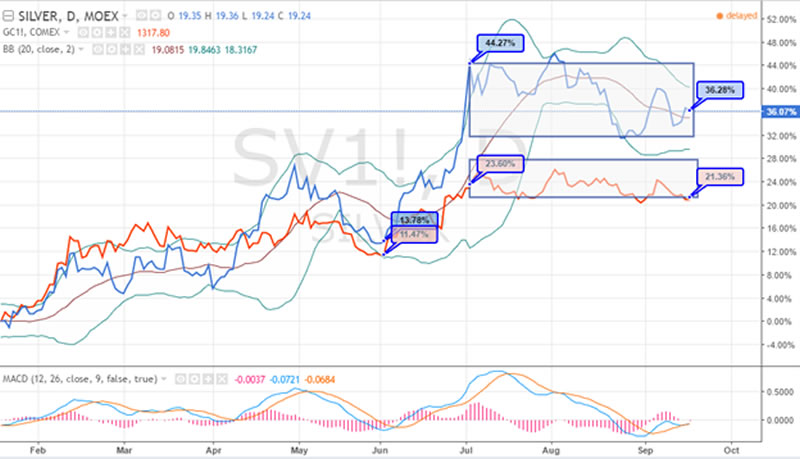
When you compare the rally in the price of silver versus that of gold, the movement was pretty similar from January to the end of May. In June, there was an upward movement for both metals, but Silver experienced a bigger spike in price. Illustratively, Gold and Silver were up YTD 11.47% and 13.78%, respectively at the start of June.
At the start of July, the price of the two precious metals was up 23.60% for Gold and 44.27% for silver. That’s a massive difference when compared to the YTD gains as of Jun 1, 2016. However, the YTD gains are now pegged at 36.28% for Silver and 21.36% for Gold.
This suggests that Silver has lost the most, especially since August as demonstrated in the chart above. So, why the spike and plunge for the sparkling silver bars?
One of the potential explanations to the kind of topsy-turvy movement we witnessed in the price of silver over the last few months could be due to its market size compared to Gold bullion. Silver is not viewed as a precious commodity that it should be.
In fact, most silver miners and producers sell the upside on their production to silver-streaming companies at relatively-low prices. Most of the silver sold is actually produced as a byproduct from mining base metals and gold. This explains why these producers and miners think so little of silver.
However, silver has its own advantages. Unlike gold, most of it is actually consumed. According to reports, more than 50% of silver demand in 2015 was attributed to industrial fabrication while coins and bars accounted for about 25%. Jewelry on the other hand, accounted for 19.4%.
As such, the real silver bars trading market is quite small compared to gold. That explains why the price of silver is so volatile compared to that of the yellow metal. The same applies when you compare it to the Dow Jones Commodity Index.
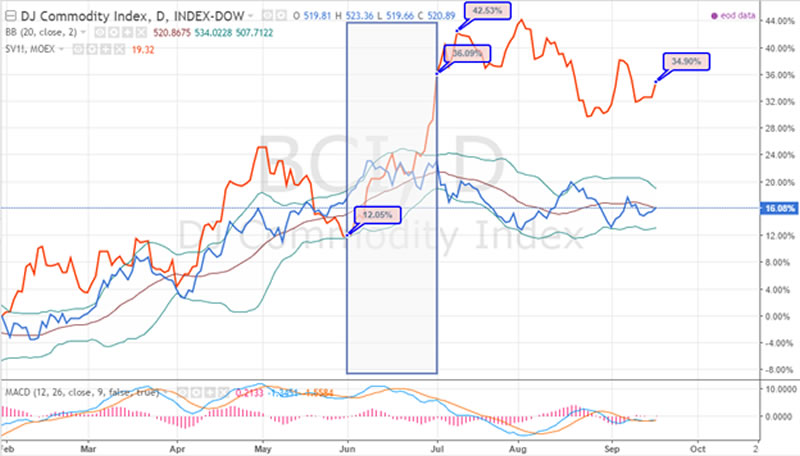
As demonstrated in the chart above, the return in the price of silver momentarily dropped about 12% YTD as of June 1, 2016, below the YTD return for the D.J. Commodities Index. After a couple of weeks, it had crossed over the Commodities Average Return curve and into orbit. Since the crossover took place, the price of the shiny metal has outperformed the D.J. Industrial Index and it looks unlikely to cross again beneath the Commodities Average Return curve.
Conclusion
In summary, the price of silver appears set for a correction, which suggests that the overbuying activity that took place in June could witness several cash outs in the coming weeks. However, the overall direction of commodity prices suggests that this could just be a breather before another rally kicks off.
By Nicholas Kitonyi
Copyright © 2016 Nicholas Kitonyi - All Rights Reserved Disclaimer: The above is a matter of opinion provided for general information purposes only and is not intended as investment advice. Information and analysis above are derived from sources and utilising methods believed to be reliable, but we cannot accept responsibility for any losses you may incur as a result of this analysis. Individuals should consult with their personal financial advisors.
© 2005-2022 http://www.MarketOracle.co.uk - The Market Oracle is a FREE Daily Financial Markets Analysis & Forecasting online publication.