U.S. Economy - We Can’t Party Like it’s 1999
Economics / US Economy Sep 20, 2016 - 05:27 PM GMTBy: Rodney_Johnson

 I came of age in the early ’80s, when Prince was king of the airwaves (pun intended). His smash hit “1999” had an end-of-days feel to it, asking everyone to “party like it’s 1999.”
As time went on and the end of the century loomed, the world grew nervous about what would happen when we reached the year 2000, or Y2K. In the end, none of the doomsday predictions came true. The computers still worked, air traffic control still functioned, hospitals and banks carried on.
But one thing did stall after 1999… income. It turns out that real median household income peaked at the end of the 20th century. Last week the Census Bureau released the income figures for 2015, and while we made a bit of headway, we still can’t party like it’s 1999.
In the late 1990s, it seemed like just about everything was going right. Business was booming, the Internet was taking off, interest rates were dropping, and equity markets were reaching record highs.
Not surprisingly, real median household income also reached record levels. This statistic reflects the inflation-adjusted level of income that divides our households in half, meaning that 50% of all households earn less than this, and 50% earn more, which makes the measurement much more useful than a simple average that can be skewed by outliers.
But right after the turn of the century, the economy turned south.
The combination of pulling business forward to comply with Y2K technical specifications and a slowdown in the Internet frenzy combined to create a nasty selloff. As we marched into recession, real median income fell. The ensuing downturn was intensified by the attacks on 9/11, but soon afterward the economy started to grow.
From late 2002 through 2007, business picked up and GDP increased, driven in large part by the housing boom. Unfortunately, the typical American household never fully recovered from the selloff of the early 2000s.
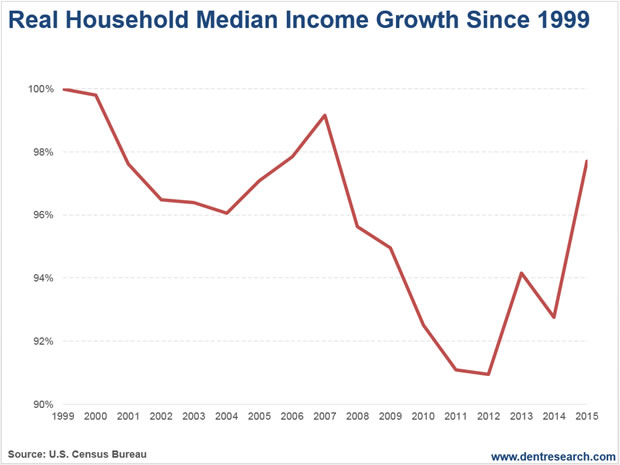
Their home might have appreciated nicely, but their paycheck never made it back to the highs of the late 1990s, when the median household pulled down $57,843. After falling 4% from the top, the closest the median household came to earning more than that was in 2007, when median income reached $57,357. That’s only about $500 less than the 1999 level, but it’s eight years later.
Well, here we are again.
It’s been another eight years, and after watching income drop again, we’re oh-so-close to reaching the levels of 2007, and possibly even 2000.
It’s been a long wait!
You can see on the chart that, as the economy fell apart in 2008 and 2009, incomes followed suit. Only this time, the drop wasn’t by a mere 4% or so. It was closer to 10%, and lasted several years as we plodded our way through the financial crisis and the modest recovery.

After bottoming in 2011 and 2012, income finally moved higher in 2013, only to drop back a bit in 2014. But this year, there’s something to celebrate… sort of.
The Census Bureau reported that median household income grew 5.2% last year, the largest increase on record! Real median income now sits at $56,516, about $500 less than it was in 2007, and more than $1,300 below the level of 1999 (There is a question as to whether or not the big jump is due to a change in questions at the Census Bureau, but that’s an article for another day!).
This is a great development, but it’s not nearly enough to jumpstart the economy. There are a million reasons we’re stuck in low gear, including low productivity and a debt hangover from the growth years. But eventually it all comes back to one thing – slack demand.
The Fed (along with every other central bank) has printed trillions of dollars, trying to motivate consumers and businesses to spend. By either making money cheap to borrow or not worth it to save, the goal was to push both borrowers and savers to shop. Judging by our anemic GDP numbers, and by extension the modest income gains, it hasn’t worked. That’s no surprise.
The most influential group in our economy, the baby boomers, passed their peak spending years in 2008-2009, and now they are focused on saving for retirement.
Low interest rates don’t entice them to borrow money, it just makes it harder for them to grow their retirement accounts.
To fully get our groove back, we have to wait for the next large generation, the millennials, to form families en masse and start down their own spending path. This transition has been delayed a few years by the slow recovery from the financial crisis, but it will happen. And when it does, we’ll finally be able to party again… like it’s 1999.
Rodney
Follow me on Twitter ;@RJHSDent
By Rodney Johnson, Senior Editor of Economy & Markets
Copyright © 2016 Rodney Johnson - All Rights Reserved Disclaimer: The above is a matter of opinion provided for general information purposes only and is not intended as investment advice. Information and analysis above are derived from sources and utilising methods believed to be reliable, but we cannot accept responsibility for any losses you may incur as a result of this analysis. Individuals should consult with their personal financial advisors.
© 2005-2022 http://www.MarketOracle.co.uk - The Market Oracle is a FREE Daily Financial Markets Analysis & Forecasting online publication.


