


New US Stock Market Uptrend Underway ?
Stock-Markets / Stock Markets 2016 Sep 17, 2016 - 11:30 AM GMTBy: Tony_Caldaro

 The week started with the SPX at 2128. After a gap down opening Monday the SPX hit 2119 then rallied to 2163 just before the close. On Tuesday another gap down opening took the SPX to 2120, then after a rally to 2141 on Wednesday the SPX hit 2120 again. On Thursday the SPX rallied to 2151, then gapped down again on Friday to 2131 before ending the week at 2139. For the week the SPX/DOW gained 0.35%, and the NDX/NAZ gained 2.60%. Three gap down openings and the market ended positive on the week. Economic reports for the week were predominantly negative. On the downtick: export prices, retail sales, NY FED, industrial production, capacity utilization, the Q3 GDP estimate, plus weekly jobless claims and the budget deficit increased. On the uptick: the Philly FED and the CPI. Next week’s reports will be highlighted by the FOMC and housing.
LONG TERM: uptrend
Markets worldwide are now seven months into the reversal off the February lows. The four major US indices have made all time new highs, as has the Wilshire 5000 an index of just US operating companies. At its recent peak the NYSE is still 3.1% below its all time high, and the DJ World index is 3.8% below. Just this week alone the four major US indices had gains ranging from 0.35% to 2.60%, while the NYSE lost 0.75% and the DJ World index lost 0.95%. It is now quite clear the NYSE composite is more of an international index, than a US index.
In OEW terms this is quite important, as the NYSE is the only US based index, of the six noted above, that quantifies with a potential Primary V underway. Suggesting an ongoing bull market from the year 2009. The other five indices, (SPX, DOW, NDX, NAZ, W5K), all quantify a new Primary III bull market, or alternately a Primary B, is underway. There is a significant difference between a Primary V scenario, and a Primary III scenario.
Under the Primary V scenario all the NYSE is required to do is to make all time new highs. Then a significant bear market would follow retracing a major portion of the entire advance from 2009. Under the Primary III scenario the bull market from the year 2009 ended in 2015, and the retracement bear market ended in 2016. This suggests a new bull market is underway that should last anywhere from two to four years, with the SPX possibly reaching 3000+. The alternate Primary B scenario is nowhere near as favorable. But will be eliminated when, and if, the SPX exceeds 2336.
As a result of this observation we will still be tracking the P5 count on the NYSE charts, but are dropping it from consideration as a viable US stock market count. The two remaining scenarios, we have been noting in recent months, will be the main and alternate counts. The Primary III scenario is now the main count, and the Primary B the alternate. The charts will now display the SPX, DOW, then NYSE, with the NAZ and NDX remaining on the second page. The DOW count displays the main P3 scenario, as well as the SPX hourly/daily charts. The alternate Primary B scenario will be displayed only on the SPX weekly chart.
MEDIUM TERM: uptrend underway?
The uptrend from SPX 1992-2194 topped in price in mid-August. But we counted that high as part of a one month expanding fifth wave diagonal triangle, which ended at SPX 2188 in early-September. Confirming that pattern the market dropped to SPX 2119 in only three days. When we count that three day decline as a zigzag, it is followed by a one day rally to SPX 2163, then a two day decline that formed a flat: 2120-2141-2120.
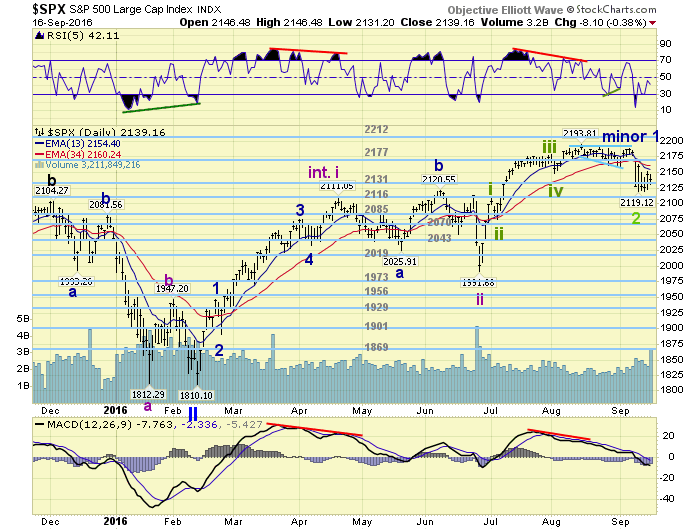
At that point we considered the downtrend potentially complete with a double three pattern. Supporting this possibility is an oversold weekly RSI similar to the last downtrend, an extremely oversold daily RSI, and an extremely oversold hourly RSI followed by a positive divergence at the SPX 2120 lows. If correct this would have been the smallest downtrend decline, in percentage terms, in the past 10 years. Which would suggest relative strength going forward. Medium term support is at the 2131 and 2116 pivots, with resistance at the 2177 and 2212 pivots.
SHORT TERM
As you probably noticed by now the daily chart above, and the hourly chart below have been updated with the main count we have been carrying on the DOW charts. Remember, this is the main count, the Primary B scenario is an alternate count, and the Primary V scenario has been left to the NYSE alone. And is not a US stock index count.
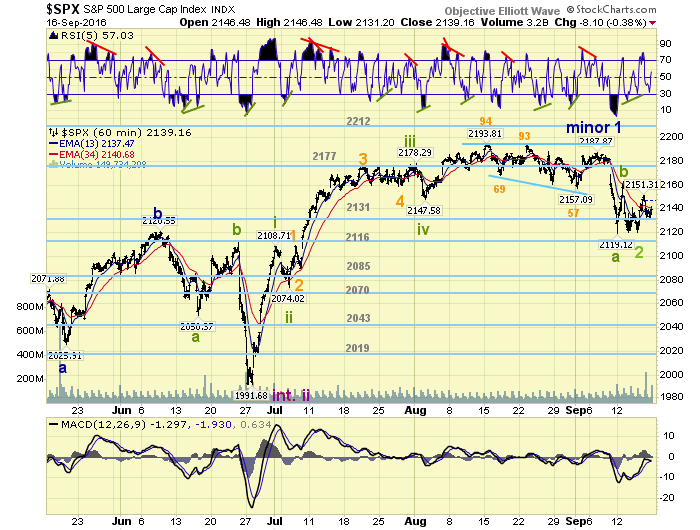
After the SPX 2120 low the market rallied to 2151, then pulled back to 2131. This could be counted as the first two waves off the downtrend low. As long as the OEW 2131 pivot range (2124-2138) holds for support a new uptrend should be underway. Any break below this range would obviously challenge the OEW 2116 pivot range, and a reassessment would be required. Short term support is at the 2131 and 2116 pivots, with resistance at the 2177 pivot and SPX 2194. Short term momentum ended the week at neutral. Best to your trading!
FOREIGN MARKETS
Asian markets were all lower for a net loss of 1.8%.
European markets were all lower for a net loss of 3.0%.
The Commodity group were all lower too for a net loss of 1.9%.
The DJ World index lost 0.95%.
COMMODITIES
Bonds are still downtrending but gained 0.1%.
Crude’s downtrend continues as it lost 6.2%.
Gold is still in a downtrend and lost 1.8%.
The USD may be in an uptrend and gained 0.8%.
NEXT WEEK
Monday: NAHB at 10am. Tuesday: housing starts and building permits. Wednesday: FOMC rate decision. Thursday: weekly jobless claims, FHFA, and existing home sales. Best to your weekend and week!
CHARTS: http://stockcharts.com/public/1269446/tenpp
After about 40 years of investing in the markets one learns that the markets are constantly changing, not only in price, but in what drives the markets. In the 1960s, the Nifty Fifty were the leaders of the stock market. In the 1970s, stock selection using Technical Analysis was important, as the market stayed with a trading range for the entire decade. In the 1980s, the market finally broke out of it doldrums, as the DOW broke through 1100 in 1982, and launched the greatest bull market on record.
Sharing is an important aspect of a life. Over 100 people have joined our group, from all walks of life, covering twenty three countries across the globe. It's been the most fun I have ever had in the market. Sharing uncommon knowledge, with investors. In hope of aiding them in finding their financial independence.
Copyright © 2016 Tony Caldaro - All Rights Reserved Disclaimer: The above is a matter of opinion provided for general information purposes only and is not intended as investment advice. Information and analysis above are derived from sources and utilising methods believed to be reliable, but we cannot accept responsibility for any losses you may incur as a result of this analysis. Individuals should consult with their personal financial advisors.
Tony Caldaro Archive |
© 2005-2022 http://www.MarketOracle.co.uk - The Market Oracle is a FREE Daily Financial Markets Analysis & Forecasting online publication.