


Stock Market Intermediate Correction Has Started
Stock-Markets / Stock Markets 2016 Sep 12, 2016 - 09:59 AM GMTBy: Andre_Gratian

 Current Position of the Market
SPX Long-term trend: The long-term trend is up but weakening. Potential final phase of bull market.
SPX Intermediate trend: The uptrend from 1810 continues, but it has entered a corrective phase.
Analysis of the short-term trend is done on a daily basis with the help of hourly charts. It is an important adjunct to the analysis of daily and weekly charts which discuss longer market trends.
Intermediate Correction Has Started
Market Overview
It was a matter of when and how. Friday gave a clear answer to both. On the opening, the index broke a minor support level, broke through the bottom trend line of the blue channel, and kept on going, briefly pausing at support levels, projections and pivot points before moving lower, all the way into the close, and ending on the low of the day with a loss of 55 points. There is some similarity to the August 2015 drop, with Friday's decline going 15 points lower on the first day. But it is doubtful that it will continue for two more days with the same intensity. In 2015, a much more important top had been built over the previous six months. Of course, we shall find out for sure on Monday!
If SPX drops another 13 points at the opening, it will have completed a .382 retracement of the uptrend from 1992. That's probably a good level at which to end the first phase of this decline and to start a countertrend rally. But this should not be the end of the entire correction. Cycles and the seasonal patterns suggest that a continuation into October/November should be expected. The amount of distribution which took place at the 2193 high also calls for a projection which could easily match a .618 retracement of the afore mentioned uptrend.
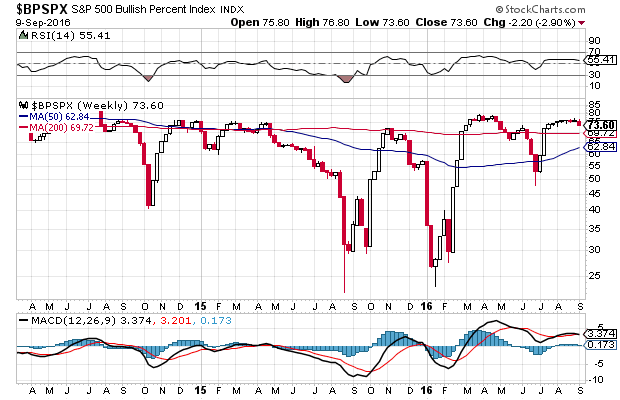
The BPSPX chart (courtesy of StockCharts.com) did not give us the warning that it did before the August drop. Back then, this indicator had already been declining for several weeks before the market fell apart. This was also the case with some other indicators.
SPX Chart Analysis
Daily chart
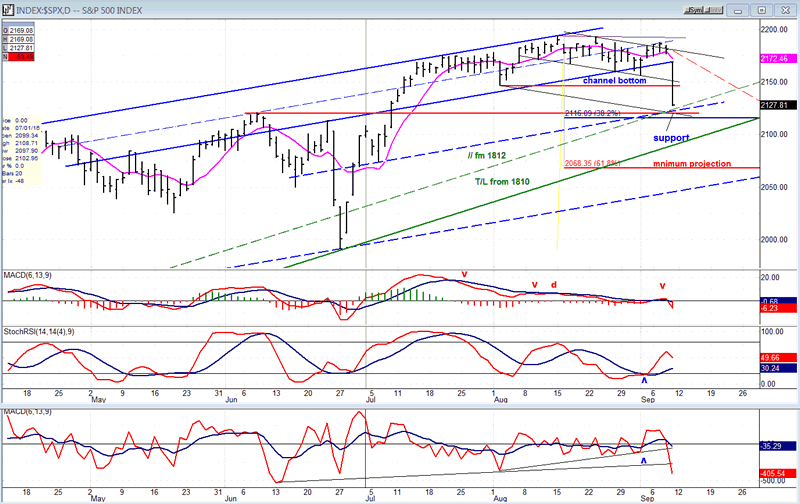
On the daily chart, the original trading channel was half of the final one, with the blue-dashed line being the first channel bottom. It was broken a couple of weeks ago and a new channel approximately twice the width of the first was formed, with the dashed line becoming the mid-channel line. Prices held on the new channel line and started to rally, but were unable to get above the dashed line, so that additional consolidation was expected with prices eventually moving out of the entire channel. What was not expected was that the correction would start with a decline of this magnitude, but after Friday's opening immediately challenged the bottom of the channel, selling started to feed on itself without any relief during the entire session.
It is possible that we could have a repeat of August 2015, but as you can see, there is strong support a few points below where we closed. Not only are we approaching the .382 retracement level, but it is buttressed by several support lines as well as the June peak. If we were to go straight through this level without pausing, then we could have a repeat of 8/15, but if we don't, the correction could take a milder path into October/November and, by then, reaching a .618 retracement of the rally from 1992.
Granted, this is a speculative assessment of what could happen over the next couple of months, but it is founded on good technical analysis, P&F and Fib projections, as well as cycles. It's at least a reasonable scenario which provides us with a model for the correction which can be revised and adjusted as the it unfolds.
The only indicator that gave us a hint that a correction was coming was the A/D oscillator which turned down on Thursday, but it did not give a sell signal until Friday. Neither the SRSI (which had started an uptrend) nor the MACD turned down until Friday.
This chart and others below, are courtesy of QCharts.com.
Hourly Chart
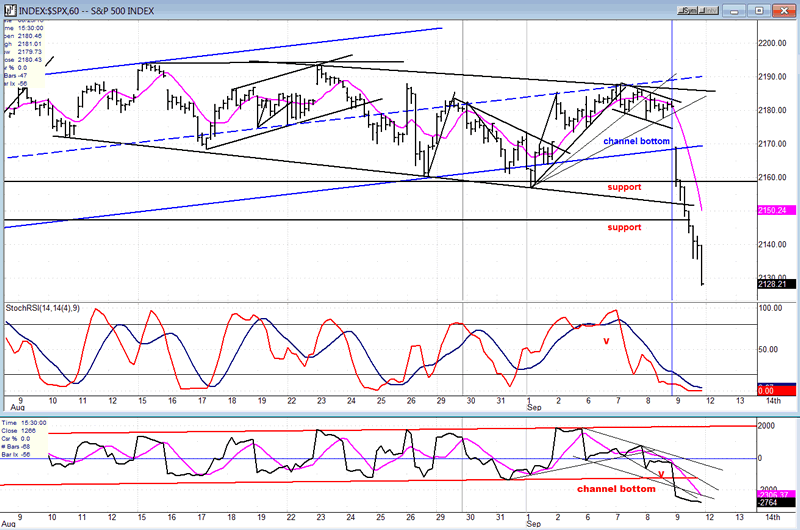
The hourly chart shows that the opening was right on the bottom channel line which was broken immediately and followed by very brief holding periods at the next three support levels as the decline progressed, some of which coinciding with minor P&F projections. The slightly more important 2148 target held for a little while longer, but there was renewed selling into the close, and even afterwards, in the futures. Quite a day!
Needless to say, the index is extremely oversold judging by all three oscillators, and I am sure that they were also extremely oversold after the first day of the August decline, but it did not prevent the market from dropping sharply lower over the next two days. Let's see if this initial down-phase stops where it logically should, between 2116 and 2120.
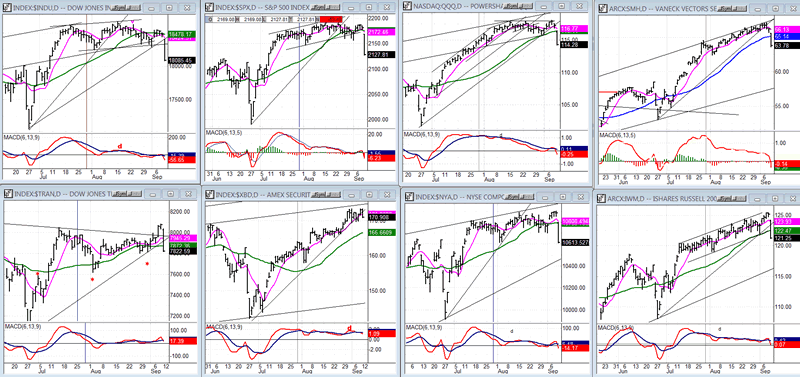
Some leading & confirming indexes (Daily charts)
Although the leading indexes displayed negative divergence, they did not give any warning that the correction would start in this manner. On Thursday IWM, NYA, and XBD closed near their recovery highs, while TRAN continued higher after a strong move on Wednesday.
Analysts who are looking for what might have triggered this event cite ECB's Draghi's press conference on Thursday morning; but if it did, there was a delayed reaction since the selling only started in the futures between Thursday night and Friday morning.
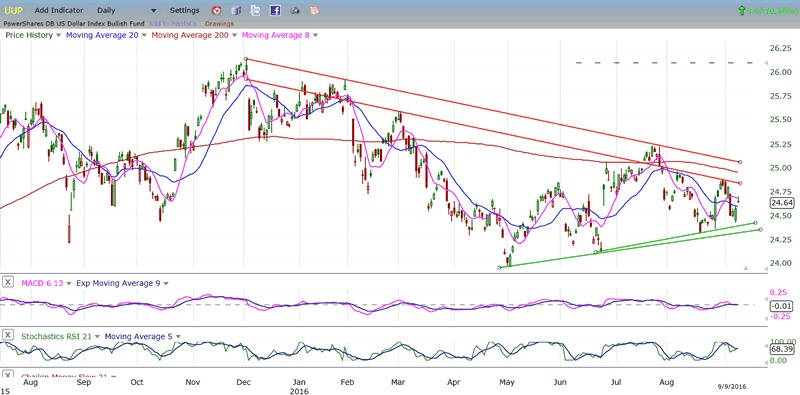
UUP (dollar ETF)
UUP continues to trade within a range, and this could result in a break-out in either direction, with a slight bias to the upside because of a higher P&F projection established at the original base – which may not necessarily be filled! We must give it some time to decide on a future path.
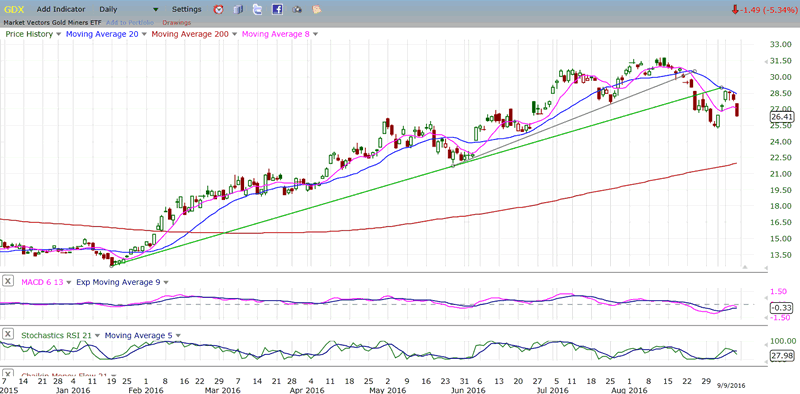
GDX (Gold Miners ETF)
GDX turned down after reaching its base projection. What could be the first phase of a probable a-b-c corrective pattern ended at 25.50 and was followed by a sharp three-point rally which ran into resistance as it back-tested the broken primary trend line. The pull-back was exacerbated by Friday's selling spree, although this index resisted the day's weakness far better than SPX. That could mean that more upside movement will take place to complete the "b" wave, with a retest of the 28.50 top needed before starting on the "c" wave.
Note: GDX is now updated for subscribers throughout the day along with SPX, on Marketurningpoints.com.
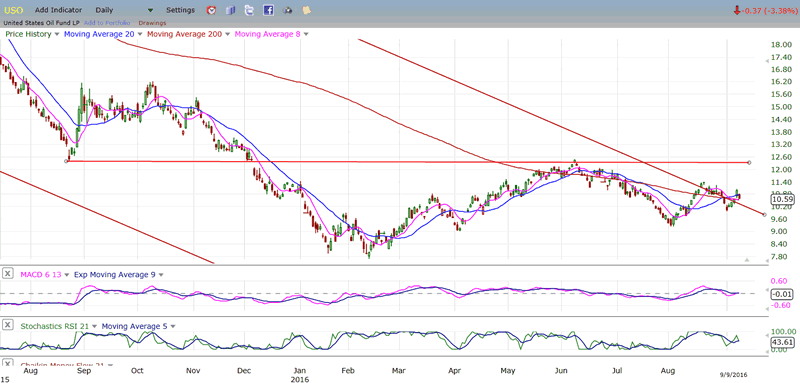
USO (US Oil Trust)
Oil got a boost from the report of a large supply deficit last week and rallied outside of its major trend line once again, but pulled back on Friday. Even if it moves out of the trend line conclusively, it should continue to form a base below the red horizontal line before it can attempt to start a significant upward trend. For this, it would require a larger base.
Summary
The topping pattern that the market had been making for the past eight weeks strongly suggested that it was preparing for correction as we approached a time slot when cycles and historical patterns made it even more likely. What was not anticipated was the violence of the initial decline.
Above, I have made a case for the level where the downtrend could find initial support, and for how deep the correction could be and how long it could last. We'll adjust this model scenario where and when necessary.
Andre
FREE TRIAL SUBSCRIPTION
If precision in market timing for all time framesis something that you find important, you should
Consider taking a trial subscription to my service. It is free, and you will have four weeks to evaluate its worth. It embodies many years of research with the eventual goal of understanding as perfectly as possible how the market functions. I believe that I have achieved this goal.
For a FREE 4-week trial, Send an email to: info@marketurningpoints.com
For further subscription options, payment plans, and for important general information, I encourage
you to visit my website at www.marketurningpoints.com. It contains summaries of my background, my
investment and trading strategies, and my unique method of intra-day communication with
subscribers. I have also started an archive of former newsletters so that you can not only evaluate past performance, but also be aware of the increasing accuracy of forecasts.
Disclaimer - The above comments about the financial markets are based purely on what I consider to be sound technical analysis principles uncompromised by fundamental considerations. They represent my own opinion and are not meant to be construed as trading or investment advice, but are offered as an analytical point of view which might be of interest to those who follow stock market cycles and technical analysis.
Andre Gratian Archive |
© 2005-2022 http://www.MarketOracle.co.uk - The Market Oracle is a FREE Daily Financial Markets Analysis & Forecasting online publication.