Stock Market Predicts Donald Trump Victory
Stock-Markets / Stock Markets 2016 Sep 11, 2016 - 04:42 AM GMTBy: Austin_Galt
 Some of you know that I like to forecast fundamentals based on my view of the technicals. We have had success with this in the past predicting a No vote in the Greek referendum on the EU bailout when polls suggested the Yes vote would prevail and also recently predicting a Brexit Leave vote when a vote to Remain was clearly favoured by the polls.
I believe the markets have a sixth sense and wrote an article about this titled The Sixth Sense of Markets, produced on the 14th April 2016, which is available to view on my website.
So, what is the market’s sixth sense saying about the upcoming US presidential election?
Before we get to that, let’s briefly revise the short term technicals of the Dow to see how I view the market setting up before Americans go to the polls in November.
DOW DAILY CHART

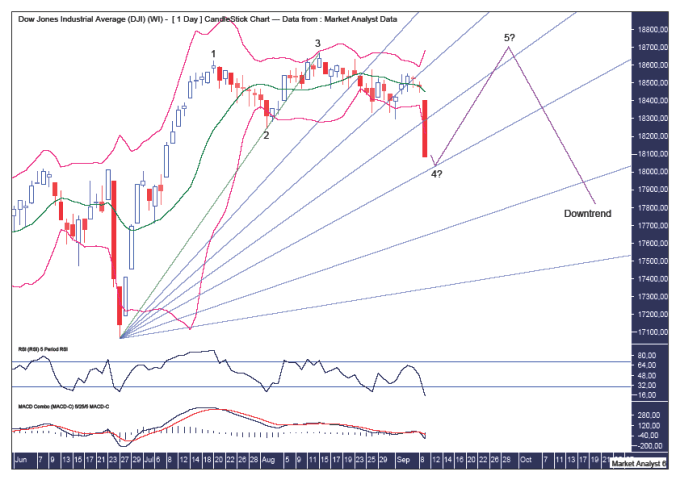
The market got clobbered at the end of last week and many might think a big move down is already underway. Not me. I believe a 5 point broadening top is now in play with price about to put in a point 4 low before reversing back up and heading to one final marginal high – the final point 5 high.
Moves into point 4 lows are often impulsive and get the crowd thinking a downtrend is in force. This move down is certainly impulsive and fits perfectly the description of how a move into a point 4 low looks.
The Bollinger Bands show price is already trading below the lower band and I expect price to spring back up shortly.
I have drawn a Fibonacci Fan from the June 2016 low to all time high and what I believe to be the point 3 high. I favour the point 4 low to be around support from the 61.8% angle. Then price trades back up to put in the point 5 high around resistance from the 50% angle. This would also be a false break high.
The RSI is well into oversold territory while the MACD indicator shows the averages have diverged a bit so a rally now would certainly not surprise.
This view of the technicals could also be applied to the upcoming September Fed meeting in that because of my very short term bullish outlook I therefore expect interest rates to remain unchanged as a rate increase would have a negative effect on price.
So, let’s say this comes to pass and we get the final high in late September or early October. That means the downtrend will have begun as we go into the November election.
Now, a Hillary Clinton victory is viewed as positive for the stock market while a Donald Trump victory is viewed as negative. This makes sense as Clinton is the more predictable candidate while Trump is more unpredictable and if there is anything the market doesn’t like it is unpredictability which induces fear.
Ok, so let’s go to the monthly chart to see how I expect price to trade after the election and thus predict the winner of the US election.
DOW MONTHLY CHART

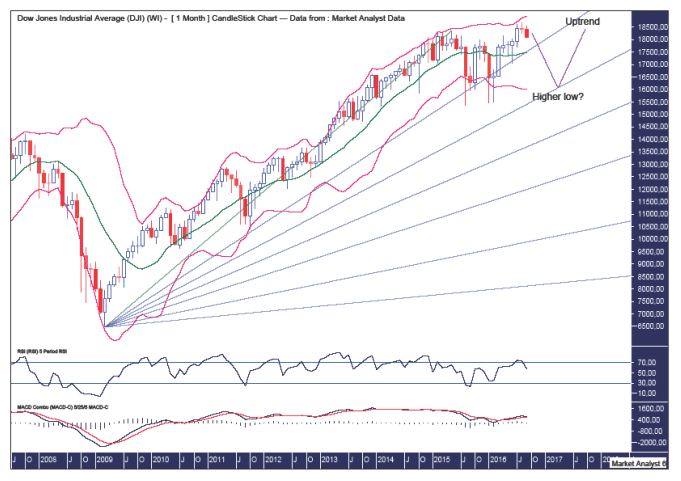
I am actually very bullish about the prospects for the stock market over the next few years. Before then, however, I believe a significant correction is set to take place which consolidates the move up off the 2016 low.
The Bollinger Bands show price is up around the upper band and I expect price to head back down to the lower band to put in a higher low.
I have drawn a Fibonacci Fan from the 2009 low to 2015 high. This shows the 23.6% angle providing support but I favour it to break shortly with the higher low to be around the next support area being the 38.2% angle.
The RSI has been in overbought territory and looks in need of a break while the MACD indicator appears to be starting to curl back down.
So, my view of the technicals is clear in expecting a top just before the US election and a significant move down after the election.
Therefore, given Trump is likely to have a short term negative impact on the stock market, my view of the technicals leads me to believe Donald Trump will win the election and be the next President of the United States.
Regardless of who wins, I am bullish the stock market over the longer term. A Trump victory would just provide a great opportunity to buy stocks at discounted prices. Given so, stock market bulls should relish the opportunity a Trump win will offer them. I actually believe Trump’s economic policies will be a positive factor for the stock market and that will eventually be reflected in price turning back up.
Now, Trump is not expected to win if the betting markets are any indication. Clinton is a clear favourite with the bookmakers while Trump is a clear outsider although his odds have been tightening.
However, just as the Greek No vote and the Brexit Leave vote were outsiders, it was my view of the stock market technicals going into each of those elections that led me to forecast the outsider would win. And so it is with Trump.
Also, adding to my confidence are two critical factors. Any political expert knows that elections are won by which way independents swing and how much of the base turns out.
Recent polls show Trump winning big with independents. In fact, a recent CNN poll showed Trump leading Clinton with independents by a massive 20 percentage points.
As for the base turning out, compare the puny turnout to Clinton rallies to the packed-to-the-rafters with lines around the block to get in to Trump rallies.
These two factors are not getting much play in the media but are clear evidence that a Trump win is well underestimated.
My expectation of a Trump win has nothing to do with my own personal political views. I don’t agree with everything that Trump says but I certainly support his right to say it especially in this world of political correctness gone mad.
I believe this election represents a choice between keeping the status quo corruption in place with Clinton or breaking it apart with Trump. Everything else is secondary. I also believe middle America has woken up to their corrupt political system and will turn out in large numbers to rectify it.
So, there it is folks.
My technical view - Donald Trump will win.
My personal view - Donald Trump is a once-in-a-lifetime opportunity to break the hold of a corrupt system that serves only those with money.
By Austin Galt
Austin Galt is The Voodoo Analyst. I have studied charts for over 20 years and am currently a private trader. Several years ago I worked as a licensed advisor with a well known Australian stock broker. While there was an abundance of fundamental analysts, there seemed to be a dearth of technical analysts. My aim here is to provide my view of technical analysis that is both intriguing and misunderstood by many. I like to refer to it as the black magic of stock market analysis.
Email - info@thevoodooanalyst.com
© 2015 Copyright The Voodoo Analyst - All Rights Reserved
Disclaimer: The above is a matter of opinion provided for general information purposes only and is not intended as investment advice. Information and analysis above are derived from sources and utilising methods believed to be reliable, but we cannot accept responsibility for any losses you may incur as a result of this analysis. Individuals should consult with their personal financial advisors.
Austin Galt Archive |
© 2005-2022 http://www.MarketOracle.co.uk - The Market Oracle is a FREE Daily Financial Markets Analysis & Forecasting online publication.


