


Gold Price In Excess Of $8000 While US Dollar Collapses
Commodities / Gold and Silver 2016 Sep 07, 2016 - 12:21 PM GMTBy: Hubert_Moolman

 The US Dollar Index is not a measure of the value of the US dollar relative to gold. However, there is a relationship between the US Dollar Index and gold price rallies.
The best gold price rallies came during periods where the US dollar index was in a declining trend.
During the 70s, for example, the US dollar index was in decline during the major gold rallies (1971 to 1974, and 1976 to 1980).
The same, but opposite, is also true for the biggest gold declines, in that they occur when the US dollar index is having its best rallies.
Below, is a US Dollar Index chart (from tradingview.com) since 2012:
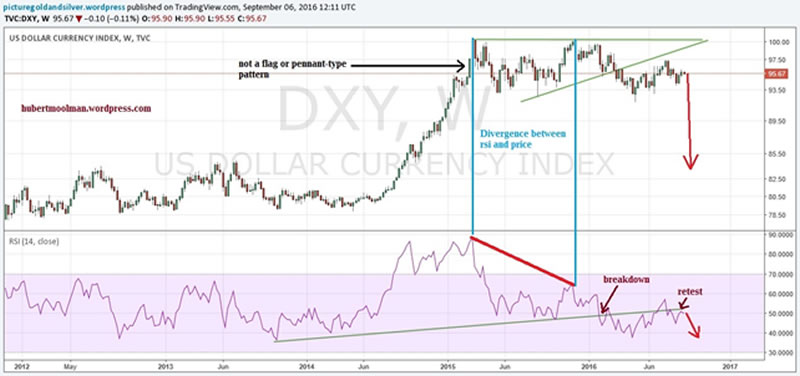
For many reasons, the price pattern since June 2014, is not likely a bullish flag or pennant-type pattern. Notice the divergence between price and the RSI (between the two blue lines) – this is one reason. Price has marginally made a higher high, however; the RSI has made a significantly lower high instead. This suggests that the US Dollar Index is going lower.
Therefore, it is likely to follow the RSI to the June 2014 breakout level, and even possibly lower. With this kind of decline in the US Dollar Index, gold is likely to have a strong rally.
Previously, I have shown how the long-term analysis of the US Dollar Index suggests that the gold rally is likely to be similar to the gold rally of the late 70s. Below, is an updated version of that chart:
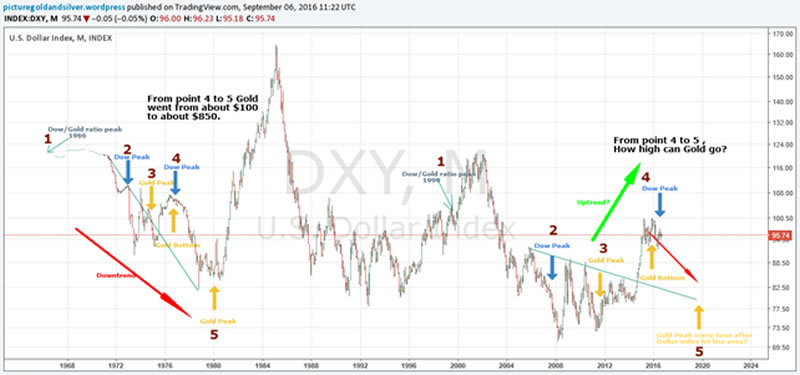
On the chart, I have marked two fractals (1 to 5). Both fractals exist in similar conditions – relative to the relevant Dow/Gold ratio peaks (1966 and 1999). If the current pattern continues to follow the 70s pattern, then the US Dollar Index is likely to decline significantly over the coming months.
This analysis also indirectly shows that gold is likely to perform in a similar manner to how it moved from about $100 to $850 in the late 70s. Furthermore, the analysis suggests that we are now at a point similar to January/February 1977. If this pattern plays out like it did in the late 70s, and gold has a similar rally, then we will see a gold price in excess of $8000.
Based on my other analysis, including the likelihood that Dow is likely to collapse during the coming US Dollar Index decline, it is very likely that the current gold rally will far exceed the one of the late 70s.
For more on this and this kind of fractal analysis, you are welcome to subscribe to my premium service. I have also recently completed a Silver Fractal Analysis Report as well as a Gold Fractal Analysis Report
Warm regards
Hubert
“And it shall come to pass, that whosoever shall call on the name of the Lord shall be saved”
http://hubertmoolman.wordpress.com/
You can email any comments to hubert@hgmandassociates.co.za
© 2016 Copyright Hubert Moolman - All Rights Reserved
Disclaimer: The above is a matter of opinion provided for general information purposes only and is not intended as investment advice. Information and analysis above are derived from sources and utilising methods believed to be reliable, but we cannot accept responsibility for any losses you may incur as a result of this analysis. Individuals should consult with their personal financial advisors.
© 2005-2022 http://www.MarketOracle.co.uk - The Market Oracle is a FREE Daily Financial Markets Analysis & Forecasting online publication.