


Gold: The Good and the Not Yet Good
Commodities / Gold and Silver 2016 Sep 03, 2016 - 10:21 PM GMTBy: Gary_Tanashian

 The Good
Thursday’s ISM report was Thing 1 in improving the backdrop for gold. But it was a small Thing. Friday’s August Payrolls report was Thing 2, and it was a better Thing. Gold and especially the gold mining sector are invigorated fundamentally during economic easing, not during economic growth phases, inflationary or otherwise.
In this post we’ll review two of the charts (gold vs. commodities and gold vs. stock markets) we have used since before the new gold bull market began in order to update some important macro fundamentals. Most of the ratios on these charts have not broken down even as the economy and with it, stock markets have experienced a recent bounce, which we anticipated through various signals belabored repeatedly, since before the BREXIT hysterics.
In the ginned up macro atmosphere the US Fed and its global cohorts have cooked up, things move quickly and we need to move even quicker. Maybe not always in action (that depends on individual trading style) but in thought and in preparedness. We were well prepared for the ‘oops, it’s not bearish!’ phase that caught most off guard coming out of BREXIT. That was due to cross referencing different indicators. We also want to be prepared for a turn the other way, not necessarily to bearish for stocks, which as we have shown, have dutifully followed money supply (see Why the Convoluted Message From Yellen?). I don’t know about you, but I find the charts in that post to be truth tellers rising above all the noise.
So all through the post-BREXIT endorphin release we have noted in NFTRH how, despite the big stock market bounce, the buoyancy in bonds, and the resurgence of some commodities, gold somehow managed to remain intact in ratio to most of these items.
Now flagging ISM and Employment, while not definitive, are definitely a welcome sign for recently beleaguered gold bugs. So too was the recently over bearish sentiment and the over sold technical readings of the sector. That micro management is generally for NFTRH premium (we noted the bounce potential in real time on Thursday in an update) but the backbone of the entire investment thesis lay in indicator charts, which represent most, but not all of the proper fundamentals for the gold sector.
Here is the updated view of two of the four ‘Gold vs.’ multi-indicator charts (the others being Gold vs. Currencies and Gold vs. various Bonds) we regularly review. Gold vs. Commodities largely remained intact to its up trends vs. most items. The exceptions are vs. palladium, which made a positive economic (bounce) signal in breaking down, and vs. silver, which indicated financial market risk ‘on’ (among other things) when it broke down. Gold-Silver then attended market (and precious metals) weakness on its recent bounce to test the breakdown. If Gold-Silver is heading back down again, it is advisable not to be short the financial markets, especially the precious metals.
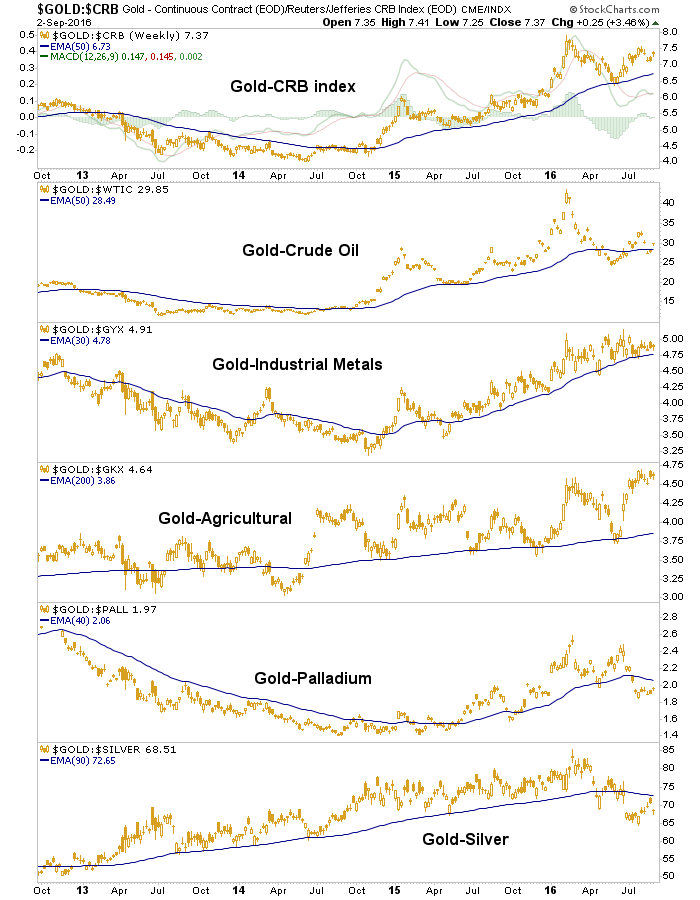
So gold did break down vs. the two ‘commodities’ that are also precious metals, palladium and silver. But it did not break down vs. the straight up commodities (though it did drop hard vs. oil) that are positively correlated to the global economy.
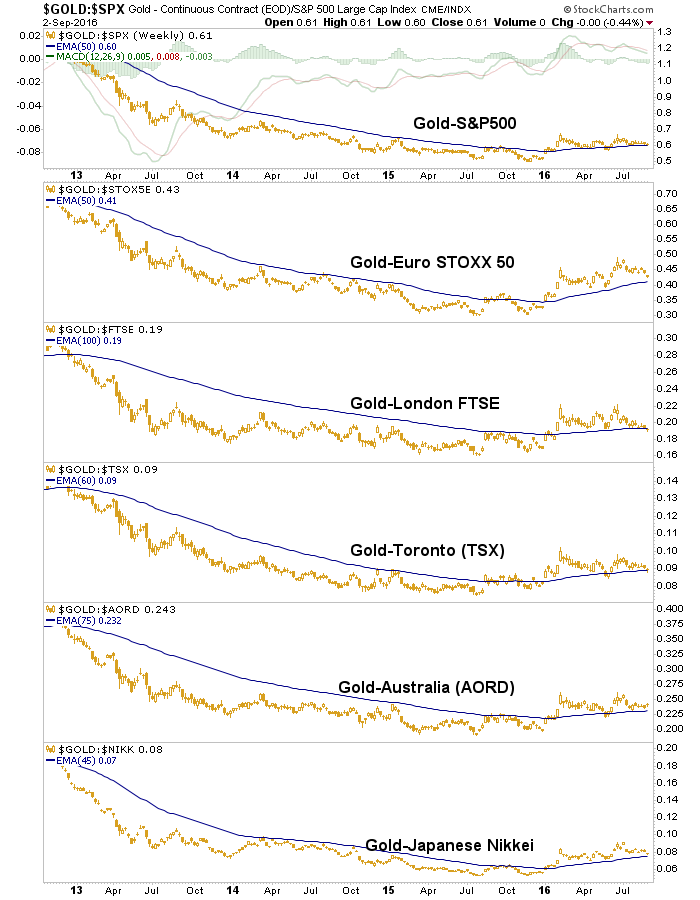
Even better, gold never broke down vs. major stock markets. We have been calling this a potential negative divergence to stocks, but probably not if gold continues to decline vs. palladium and especially silver, which would indicate a more risk ‘on’ and economically benign environment.
The Not Yet Good
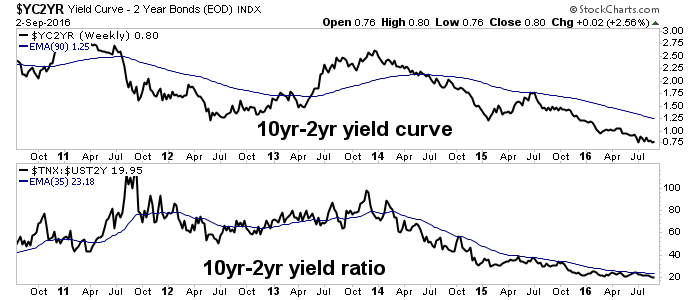
Yield curves have not been beneficial. A rising curve can indicate one of two things; stress in the financial system as yields decline but short-term yields decline faster (in a rush to risk ‘off’ liquidity) or an inflationary environment, as yields rise but long-term yields rise faster. So far, it’s not happening. Yield curves are benign and market friendly and while I’d expect the curve to be driven upward by one of the two noted conditions, so far all’s well and the stock market’s rally is well founded by this indicator. Gold’s bull market may be looking ahead to a rise in the curve, but so far this is a holdout fundamental.
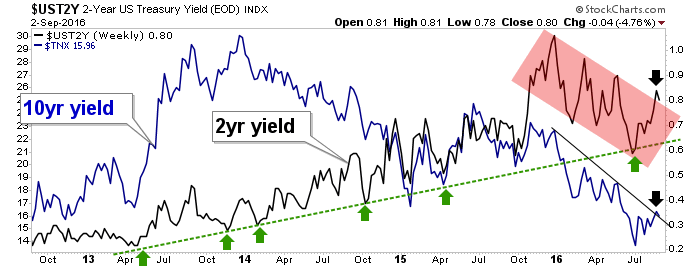
The nominal view of the 10’s and 2’s shows that the 2 year yield remains in a post-2012 uptrend but has trended down in 2016. The longer uptrend remains a potential hazard for gold bugs unless the curve above starts to rise.
Another sign that inflation is not yet in play is commodities vs. stocks, which are as yet a non starter.
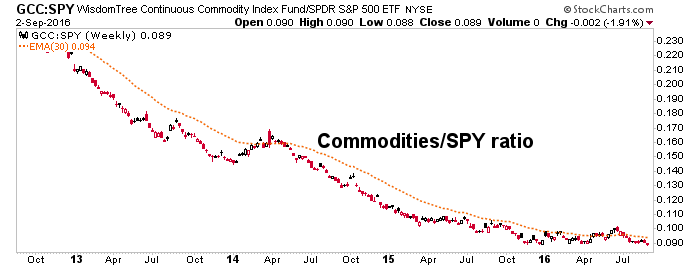
Amazing how similar this chart looks to the yield curve, isn’t it? But gold’s best fundamental environment is not inflationary, it’s best fundamental backdrop is a risk off, liquidity constrained situation. Yet like the inflationary scenario, that has not yet engaged either. We are likely in process to one of these situations, inflationary asset speculation or deflationary liquidation. How’s that for disparity?
Regardless, it’s benign now and with the tepid jobs and manufacturing data last week, the risk ‘on’ trade is emboldening once again. ‘Come on in, the water’s fine!’ beckon the bulls. For now, gold is just another casino patron at the party. That will not remain the case forever.
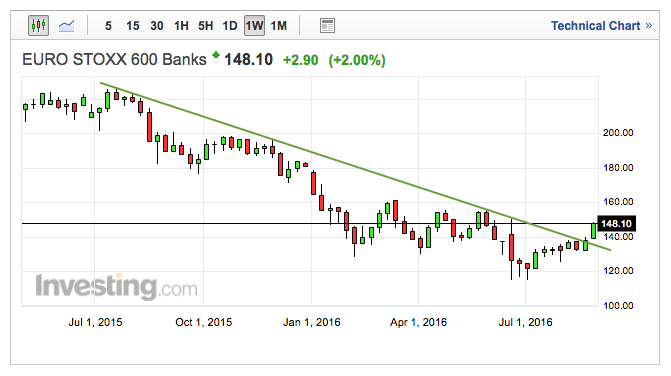
I wonder if our friends, the Pigs, are actually showing the way to an eventual global inflationary resolution. Aside from the US Bank sector, which we have been tracking in recent weeks and noted here on Tuesday, global banks are starting to break out as well. European and Japanese Bank indexes look like they are making moves.
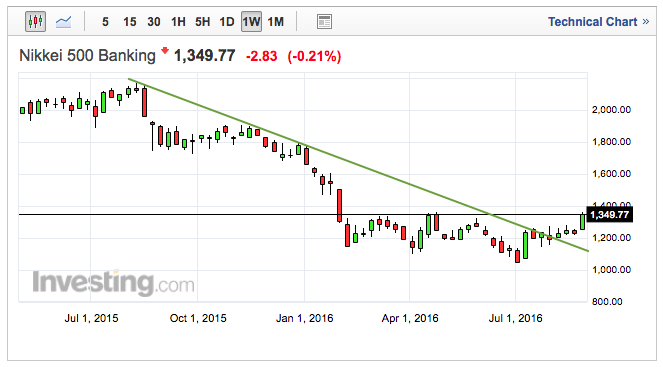
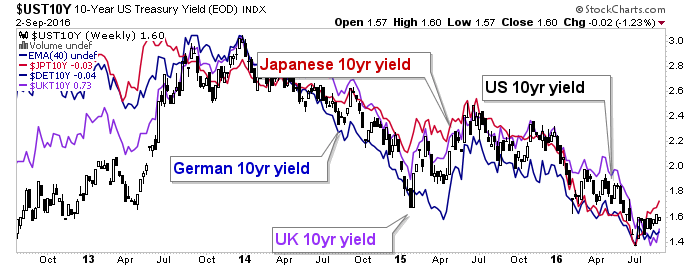
Is the jig up on global NIRP? Will confidence in Central Bankers take yet another hit? The waning of confidence in these clowns is after all one of the major, though admittedly blunt, fundamentals for gold. Here is the state of US and global bond markets, in the face of NIRP, as inflicted by desperate policy makers. These items remain in downtrends but one wonders if the Banks are looking ahead to something more than a bounce. Look at the Japanese 10 year.
Bottom Line
Markets do not move at the speed of the functions in the frontal lobe of your brain. They move at the speed of a sloth with lots of frenetic activity (i.e. noise) along the way. Gold has made a big move in 2016 and the sector became over sold last week and ripe for a bounce. What’s more, some fundamentals improved. But the market has not yet shown its hand on what the ultimate drivers will be.
We’ll manage the sector’s technicals, as always, in NFTRH (gold stocks for instance, while on the expected bounce, generally remain below important resistance levels) but the true fundamental picture is in the process of revealing itself. Don’t let the Easy Answer Brigade fool you with talk about how simple the situation is. Whether it is someone using index and stock charts in a vacuum, someone else touting inflation or another guy working the Armageddon shtick. As you can see by the somewhat confusing narrative above, this is not at all simple my friends. With non stop aggressive and experimental policy input since 2008, how can it be? Be prepared to work at this and guard against automatic and linear thinking. It’s a financial Wonderland after all.
Subscribe to NFTRH Premium for your 25-35 page weekly report, interim updates (including Key ETF charts) and NFTRH+ chart and trade ideas or the free eLetter for an introduction to our work. Or simply keep up to date with plenty of public content at NFTRH.com and Biiwii.com.
By Gary Tanashian
© 2016 Copyright Gary Tanashian - All Rights Reserved
Disclaimer: The above is a matter of opinion provided for general information purposes only and is not intended as investment advice. Information and analysis above are derived from sources and utilising methods believed to be reliable, but we cannot accept responsibility for any losses you may incur as a result of this analysis. Individuals should consult with their personal financial advisors.
Gary Tanashian Archive |
© 2005-2022 http://www.MarketOracle.co.uk - The Market Oracle is a FREE Daily Financial Markets Analysis & Forecasting online publication.