SPX Uptrend Extending?
Stock-Markets / Stock Markets 2016 Sep 03, 2016 - 10:02 PM GMTBy: Tony_Caldaro
 The week started at SPX 2169. After a rally to SPX 2183 on Monday the market pulled back to 2161 by Wednesday. Thursday started off with a rally to SPX 2174, dropped to 2157, then the market rallied to 2185 by Friday. For the week the SPX/DOW gained 0.50%, and the NDX/NAZ gained 0.45%. Economic reports for the week had twice as many gainers as losers. On the downtick: the ADP, ISM, auto sales, monthly payrolls and weekly jobless claims increased. On the uptick: personal income/spending, the PCE, Case-Shiller, consumer confidence, the Chicago PMI, pending home sales, factory orders, the Q3 GDP estimate, plus the trade balance improved. Next week’s reports will be highlighted by the FED’s beige book and ISM services. Best to your week!
LONG TERM: uptrend
For the past several weeks we have been offering three different counts regarding the US market. Last week we upgraded one count, posted on the DOW charts, to the primary count. In probability terms we suggested 40%-30%-30% for the three counts. We have not observed anything new to change these probabilities.
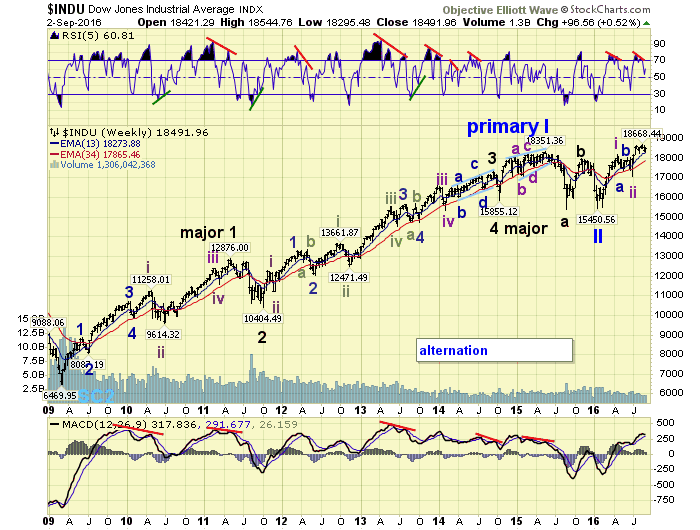
The DOW count suggests a Primary I bull market unfolded from 2009-2015. Then over a 9-month period into February 2016 a Primary II bear market unfolded. This suggests a Primary III bull market is now underway from that February 2016 low. With the DOW in new high territory, and having a difficult time to even establish a correction, we see no reason to alter this view.
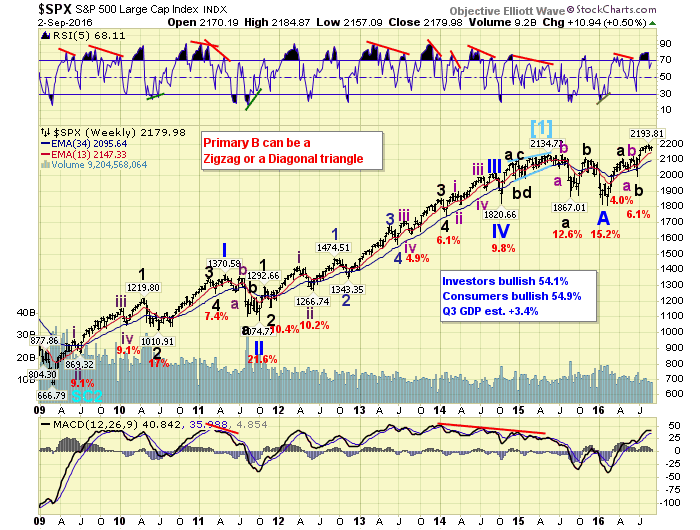
The SPX count suggests the advance from the February 2016 low is a Primary B wave of an ongoing, unorthodox bear market. While this is a fairly popular count among the bears, it suggests the upside limit for Primary B is SPX 2336 (1.618 x Primary A). Should the SPX exceed that level the count will be eliminated.
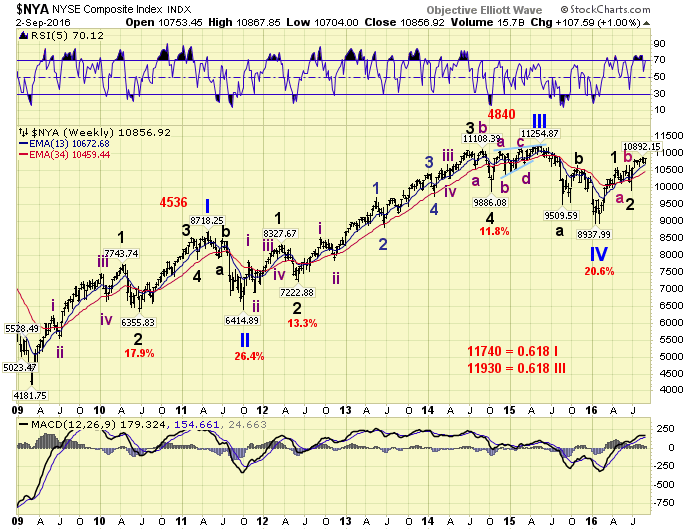
The NYSE count is clearly the most popular among the bulls. It suggests Primary waves I and II ended in 2011, Primary III ended in 2015, Primary IV ended in 2016, and Primary wave V is currently underway. We have explained in previous weeks why we do not find this count to be representative of the US stock market. It looks more representative of a foreign index than a US index. All of the major US indices have already made new all time highs, while none of the foreign indices have. And as you can see, neither has the NYSE.
MEDIUM TERM: market resists entering a correction
The current uptrend began in late-June at SPX 1992 and rallied to 2194 by early-August. After counting five waves up from that low to the high we expected a correction. It has been nearly three weeks and we are still waiting. Thus far all the SPX has done is a series of three 3-wave declines with slightly lower lows, while remaining in a SPX 2157-2194 2% trading range. Each time the market has dropped below the OEW 2177 pivot it has turned right around and rallied above it again.
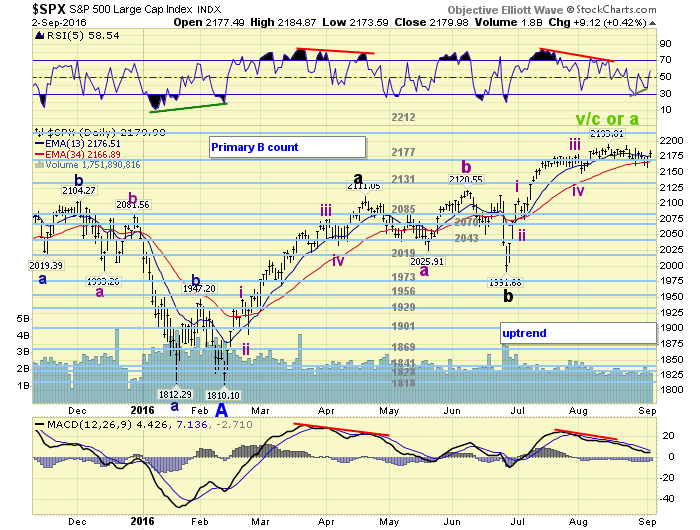
After three weeks of choppy activity we perused the charts Friday to look for any deterioration in either the SPX sectors or the foreign markets. We didn’t find any. Typically when a SPX downtrend is underway the SPX sectors start breaking down first then the SPX follows. As of Friday only 33% of the sectors are in downtrends, and 44% are close to, or at, their uptrend highs. Also the foreign markets usually lead to the downside as well. As of Friday only 15% of the foreign markets are in downtrends, and 35% made new uptrend highs on Friday. It looks more like strength than weakness. Also the TRAN, SOX and R2K, are at or close to their uptrend highs.
Looking at the technicals, we see all the major indices displayed a daily positive divergence at Thursday’s low. Which was the lowest low of the pullback across the board. This usually occurs at end of downtrend lows. If it wasn’t for the strength in the foreign indices we would think we just completed an A wave of the correction, with a B wave now underway, and a C wave down to follow. After a two month 200-point uptrend the market has worked off the overbought condition by just drifting lower for three weeks. All these factors suggest the market may be ready to extend its uptrend without a correction at this time. Medium term support is at the 2177 and 2131 pivots, with resistance at 2212 and 2252 pivots.
SHORT TERM
As noted above we counted five waves up into the uptrend high: 2109-2074-2178-2148-2194. Then we counted three 3-wave declines into the low: 2169-2193-2160-2183-2157. Then after setting up the daily/hourly positive divergences on Thursday the market rallied, with a gap up, to SPX 2185 on Friday.
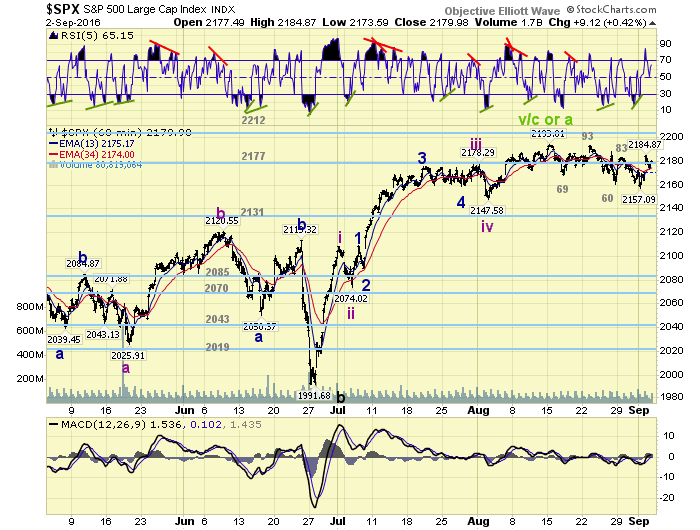
Reviewing the entire uptrend we observe three large pullbacks, in order: 35 points, 30 points, and 37 points. The first two took a couple of days. This last one has taken nearly three weeks. With declines this similar it also suggests this uptrend may extend. With the market closing at SPX 2180 on Friday, and the uptrend high only 14 points away, it may not take long to find out.
Short term support is at the 2177 pivot and SPX 2157, with resistance at SPX 2194 and the 2212 pivot. Short term momentum ended the week just above neutral. Best to your trading, come Tuesday!
FOREIGN MARKETS
Asian markets were mixed on the week and gained 0.2%.
European markets were all higher and gained 2.0%.
The Commodity equity group were mixed but gained 1.3%.
The DJ World index is in an uptrend and gained 0.9%.
COMMODITIES
Bonds are in a downtrend but gained 0.2%.
Crude is trying to uptrend but lost 6.7% on the week.
Gold is trying to reverse its downtrend and gained 0.1% on the week.
The USD is also trying to uptrend and gained 0.3%.
NEXT WEEK
Monday: holiday. Tuesday: ISM services at 10am. Wednesday: the FED’s beige book. Thursday: weekly jobless claims and consumer credit. Friday: wholesale inventories. Best to your 3-day weekend and week!
CHARTS: http://stockcharts.com/public/1269446/tenpp
After about 40 years of investing in the markets one learns that the markets are constantly changing, not only in price, but in what drives the markets. In the 1960s, the Nifty Fifty were the leaders of the stock market. In the 1970s, stock selection using Technical Analysis was important, as the market stayed with a trading range for the entire decade. In the 1980s, the market finally broke out of it doldrums, as the DOW broke through 1100 in 1982, and launched the greatest bull market on record.
Sharing is an important aspect of a life. Over 100 people have joined our group, from all walks of life, covering twenty three countries across the globe. It's been the most fun I have ever had in the market. Sharing uncommon knowledge, with investors. In hope of aiding them in finding their financial independence.
Copyright © 2016 Tony Caldaro - All Rights Reserved Disclaimer: The above is a matter of opinion provided for general information purposes only and is not intended as investment advice. Information and analysis above are derived from sources and utilising methods believed to be reliable, but we cannot accept responsibility for any losses you may incur as a result of this analysis. Individuals should consult with their personal financial advisors.
Tony Caldaro Archive |
© 2005-2022 http://www.MarketOracle.co.uk - The Market Oracle is a FREE Daily Financial Markets Analysis & Forecasting online publication.


