


FTSE Possible Double Top Before Lengthy PBrexit Consolidation
Stock-Markets / UK Stock Market Aug 08, 2016 - 02:57 PM GMTBy: Ken_Ticehurst

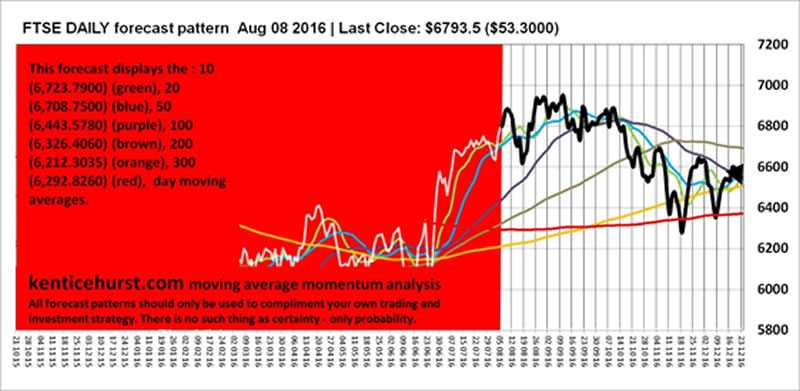
 The FTSE has had a dramatic run since Brexit and appears on a short term basis to be overbought, our current forecast is for a high over the coming weeks at or about 7,000, this short term top remains likely as long as the 10, 20 and 50 day moving averages remain in positive alignment.
You will notice the 300 day moving average beginning to turn up in a positive fashion in our forecast whilst price becomes weak, that is a perfectly reasonable part of a consolidation process. The 50 day moving average should act as support if we get a mini consolidation before we get to 7,000.
Our weekly forecast shows the 200 and 300 week moving averages are in a positive alignment this is long term bullish, we are forecasting that they will squeeze together with the 300 continuing to rise steadily, the 50 week moving average has started squeezing with the 300 week moving average.
Currently price is extremely overextended above the 50 and 100 week moving averages which considering they are in a bearish alignment is not a good sign for the coming weeks and months.
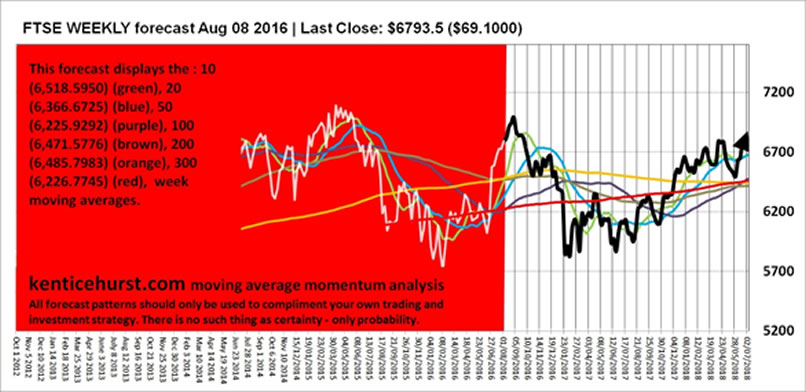
So currently we are expecting a top in the coming weeks followed by a long consolidation with the possibility of a long term buying opportunity to come, any falls should not be too severe.
As with all our forecasts we offer a road map for the trade or investment idea, our subscribers also get to see our longer term monthly forecast which adds even more detail.
You can follow our free forecasts on our web site, we post regularly on our twitter account which is embedded on our home page. Our forecasts use our moving average momentum analysis technique which coupled with our proprietary software, analyses each market we cover looking for probable patterns.
Because we now publish the underlying patterns our subscribers get unrivalled access to some of the most unique forecast charts available, and get a trading and investment edge over their competitors.
Our forecasts are fractal patterns that last for months and years, we monitor the development of these probable patterns continually to ensure we are on track. Our methodology is to create a most probable long term fractal pattern and then continually test it and model it over multiple time frames to ensure the pattern remains a probable event.
Ken Ticehurst
You can read more about our unique foresting system and moving average momentum analysis at our website: http://www.kenticehurst.com
Copyright 2016, Ken Ticehurst. All rights reserved.
Disclaimer: The above information is not intended as investment advice. Market timers can and do make mistakes. The above analysis is believed to be reliable, but we cannot be responsible for losses should they occur as a result of using this information. This article is intended for educational purposes only. Past performance is never a guarantee of future performance.
© 2005-2022 http://www.MarketOracle.co.uk - The Market Oracle is a FREE Daily Financial Markets Analysis & Forecasting online publication.