Gold Price Is Now On Its Way To All-Time Highs
Commodities / Gold and Silver 2016 Aug 02, 2016 - 12:17 PM GMTBy: Hubert_Moolman
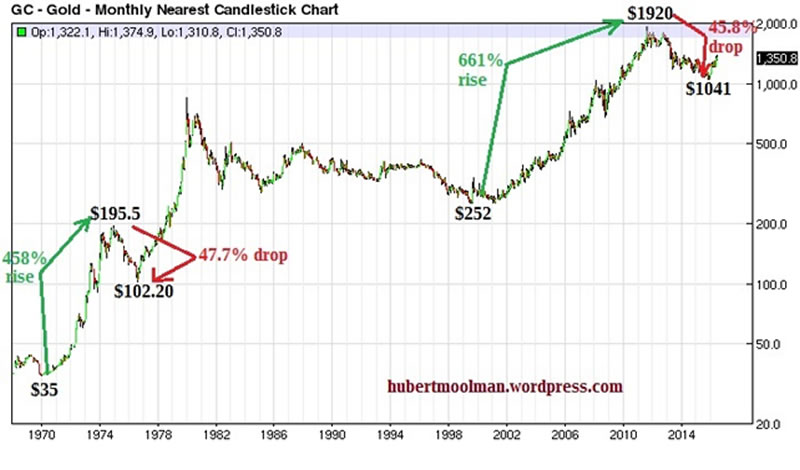
 I have compared the performance of the current gold bull market (since 2001) with the 70s one. Below is that comparison (chart from barchart.com):

During the 70s bull market, gold went from $35 to $195 in the first phase. That was a 458% increase. The first phase of the current bull market took gold from $252 to $1920, which made for a 661% increase.
At first glance, it would appear that the current bull market outperformed the 70s one. However, it only took about five years (1970 to 1975) to get the 458% increase, compared to the roughly ten years and five months it took to get the 661% increase. If the performance of the current bull market actually matched that of the 70s, then prices should have risen about 1000%.
The decline from the peak of the first phase of the 70s, took gold from $195.5 to $102.2, a 47.7% drop. The decline from the peak of the first phase of the current bull market, took gold from $1920 to $1041, a 45.8% drop.
The declines are almost similar in extent (47.7% vs 45.8%), however; the decline in the 70s only took about one year and nine months, whereas the decline since 2011, took about four years and three months.
The 70s decline lasted about 35%(1yr 9months/5yrs) of the period of the rise, whereas the decline since 2011 lasted about 40.8% (4yrs 3months/10yrs 5 months) of the period of the rise. This shows that the declines are almost similar relative to the period of the rise in prices.
So, given the above, it appears that the current bull market’s upleg has actually lagged the upleg of the 70s bull market on a relative basis, whereas the declines have almost been similar.
To find reasons for the lag of the current bull market’s upleg, we can look at how the conditions compare, between the two bull markets. Interest rates and stock market movements, for example, provide a good understanding for economic conditions that affect gold prices.
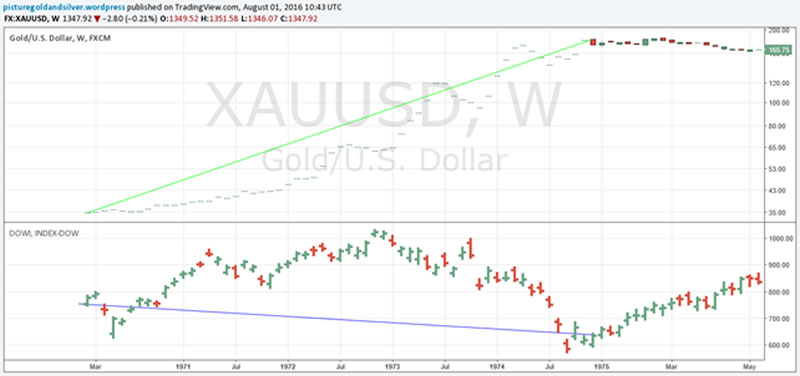
Below, is a comparison of gold prices and the Dow during the first phase of the 70s gold bull market (from tradingview.com):

The net movement of the Dow during the whole first upleg of gold (70s) was down. That contributed positively towards conditions for gold (refer to my articles on the relationship between silver and the Dow).
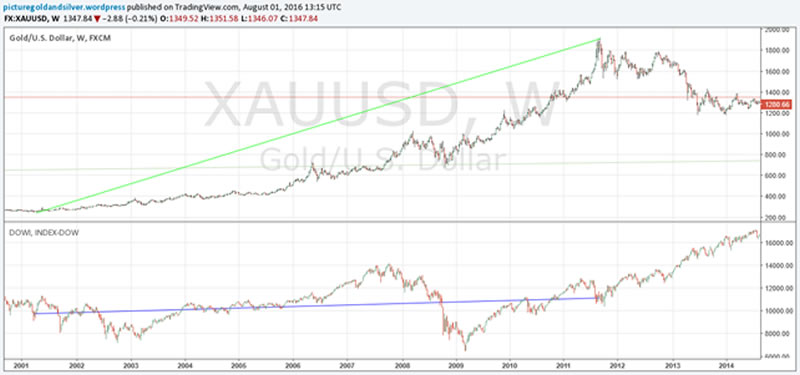
Below, is a comparison of gold prices and the Dow during the first phase of the current bull market:

The net movement of the Dow during the whole first upleg of gold (current) was up. That contributed negatively towards conditions for gold.
Note that there was a significant Dow crash during both initial uplegs. However, the timing was different. The timing of the 70s Dow crash was more beneficial for gold prices, especially since stock prices were falling all the way from around the middle to the end of the gold rally.
On the other hand, during the current period, stock prices were rising together with gold prices, all the way during the last third of the gold rally.
Below, is a long-term chart (from macrotrends.net) of interest rates (10-year treasury):
On the chart, I have indicated the net movement for interest rates during the first phase of both gold bull markets. The net interest rate movement during the first phase of the 70s gold bull market was only slightly down (almost flat). This contributed negatively (only slightly) towards conditions for gold (for the reasons why lower interest rates are negative for gold).
The net interest rate movement during the first phase of the current gold bull market was down significantly. This contributed very negatively towards conditions for gold.
With interest rates at all-time lows and the Dow at all-time highs things can potentially work out very well for gold prices, provided that the Dow is actually topping, and interest rates are actually putting in a bottom.
The long-term gold chart suggests that it could certainly be so:
I have marked two fractals (patterns) 1 to 4. The first one is the 70s bull market, and the second one is the current bull market. We are currently just after point 3, and gold is on its way to point 4, which will be significantly higher than the 2011 high.
For more on this and this kind of fractal analysis, you are welcome to subscribe to my premium service. I have also recently completed a Silver Fractal Analysis Report as well as a Gold Fractal Analysis Report
Warm regards
Hubert
“And it shall come to pass, that whosoever shall call on the name of the Lord shall be saved”
http://hubertmoolman.wordpress.com/
You can email any comments to hubert@hgmandassociates.co.za
© 2016 Copyright Hubert Moolman - All Rights Reserved
Disclaimer: The above is a matter of opinion provided for general information purposes only and is not intended as investment advice. Information and analysis above are derived from sources and utilising methods believed to be reliable, but we cannot accept responsibility for any losses you may incur as a result of this analysis. Individuals should consult with their personal financial advisors.
© 2005-2022 http://www.MarketOracle.co.uk - The Market Oracle is a FREE Daily Financial Markets Analysis & Forecasting online publication.


