


US Economy - 3 Charts Economists Want to Keep Secret
Economics / US Economy Aug 01, 2016 - 07:19 PM GMTBy: EWI

 Despite new all-time highs in the stock market, US economic data is lagging. In fact, real GDP per person just dropped to its lowest level in more than 75 years!
While major news outlets never miss a chance to jump on that latest negative trend from society, they seem reluctant to cover basic economic figures that could spell bad news for millions of Americans. Yet the steady dive in US economic performance has recently become too pronounced to ignore.
Take this chart of the 10-year rate of change in US GDP per capita:
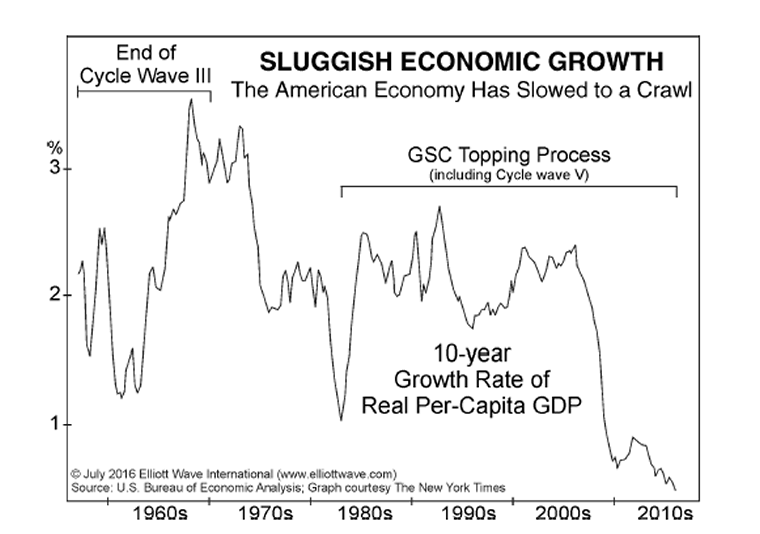
This chart is an updated version that first appeared in Robert Prechter's 2002 New York Times bestseller, Conquer the Crash. In the opening chapter, Prechter wrote:
When historians return to this time, I suspect that they will discover the slow but persistent regression in both U.S. and world-wide growth over the decades in the latter half of the 20th century and wonder why so few recognized it as a signal of the coming change.
When a major New York daily newspaper finally took notice of this data this year, it asked a slate of economists, "What's wrong with the economy?"
Responses ranged from "a statistical mirage" to a "hangover" from the 2008-2009 recession. Yet the charts, data and figures -- for people who are willing to take an honest look at such statistics -- reveal something far more insidious.
Has the same exuberant mood that propelled stocks to new all-time highs also pulled the wool over economists' eyes, causing them to ignore critical early-warning signs of a dangerous new trend taking hold?
I invite you take a look at an eye-opening new 2-page report -- a quick 5-minute read from our friends at Elliott Wave International -- that answers these questions and shows you two more charts that you will probably not see from any other source.
All together, these three charts show what's really wrong with the US economy, which is why I think most economists would rather keep them secret.
Please follow this link to see all three charts and read our commentary now.
Regards,
About the Publisher, Elliott Wave International
Founded in 1979 by Robert R. Prechter Jr., Elliott Wave International (EWI) is the world's largest market forecasting firm. Its staff of full-time analysts provides 24-hour-a-day market analysis to institutional and private investors around the world.
© 2005-2022 http://www.MarketOracle.co.uk - The Market Oracle is a FREE Daily Financial Markets Analysis & Forecasting online publication.