


WTI Forecast Pattern Suggests Higher Crude Oil Prices Coming
Commodities / Crude Oil Aug 01, 2016 - 01:10 PM GMTBy: Ken_Ticehurst

 WTI having recently topped out at $50 per barrel, is now possibly ending a decent consolidation having moved off its start of the year lows. Our longer term patterns show the strong possibility of a rise to $60+ during the second half of this year before a further decline in to 2017.
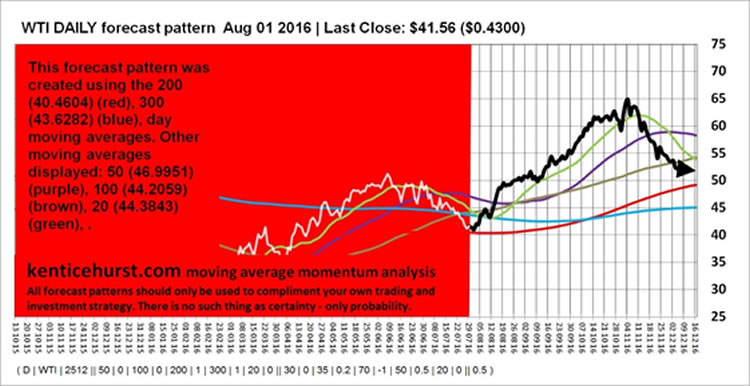
The current most likely short term pattern that fits our longer term analysis would see price hold at around $40 per barrel over the next few days before a new leg up fuelled by the 50 and 100 day moving averages squeezing together. This would be the catalyst for a move towards what we believe would be long term resistance in the $60+ range, we could even get to $70 per barrel.
The first target is to hold the 200 and 300 day moving averages or at least get back above them and then see price close above the 20 and 300 day moving averages, ideally with the 20 day still above the 300 day. The next and final hurdle would be a close above the 50 day moving average, provided the 50 day and the 100 day are in a postive alignement then the bulls should be on the right side for a good win towards the end of the year.
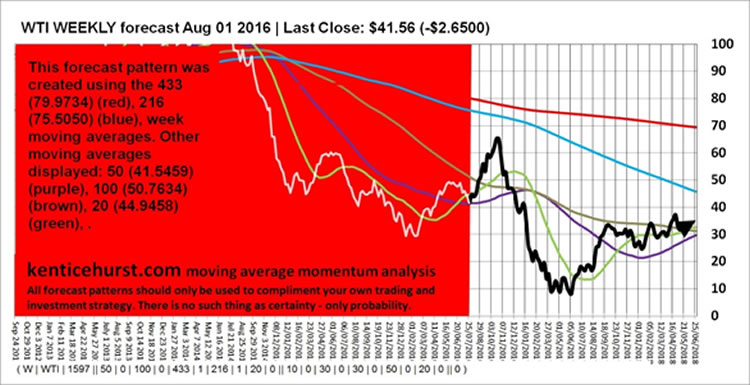
We believe that we are currently in the mid point of a dead cat bounce in crude oil with at least a possible retest of the recent lows in 2017. Our weekly forecast shows we are more than likely in a longer term downtrend, our main pattern above is the 50 and 100 week moving averages consolidating and potentially squeezing together.
This forecast represents the most bullish case we can really find for WTI at present but also the most probable. As we mentioned should the 50 day move below the 100 day moving average then then we would be far less bullish it could be that this bounce is smaller than we are forecasting.
As with all our forecasts we offer a road map for the trade or investment idea, our subscribers also get to see our longer term monthly forecast which adds even more detail.
You can follow our free forecasts on our web site, we post regularly on our twitter account which is embedded on our home page. Our forecasts use our moving average momentum analysis technique which coupled with our proprietary software, analyses each market we cover looking for probable patterns.
Because we now publish the underlying patterns our subscribers get unrivalled access to some of the most unique forecast charts available, and get a trading and investment edge over their competitors.
Our forecasts are fractal patterns that last for months and years, we monitor the development of these probable patterns continually to ensure we are on track. Our methodology is to create a most probable long term fractal pattern and then continually test it and model it over multiple time frames to ensure the pattern remains a probable event.
Ken Ticehurst
You can read more about our unique foresting system and moving average momentum analysis at our website: http://www.kenticehurst.com
Copyright 2016, Ken Ticehurst. All rights reserved.
Disclaimer: The above information is not intended as investment advice. Market timers can and do make mistakes. The above analysis is believed to be reliable, but we cannot be responsible for losses should they occur as a result of using this information. This article is intended for educational purposes only. Past performance is never a guarantee of future performance.
© 2005-2022 http://www.MarketOracle.co.uk - The Market Oracle is a FREE Daily Financial Markets Analysis & Forecasting online publication.