


Stock Market Insiders Are Secretly Selling, Cycle Top Next Month
Stock-Markets / Stock Markets 2016 Jul 28, 2016 - 05:59 PM GMTBy: Chris_Vermeulen

 It was “Panic Buying” that pushed the Dow Jones and the SPX Indices to record highs. To be sure there is trouble brewing in this rally. Smart money has left the stock market, as the charts at the end of this article will display!
While Wall Street insiders appear to know that something is seriously amiss with the economy, no one is warning the retail investor.
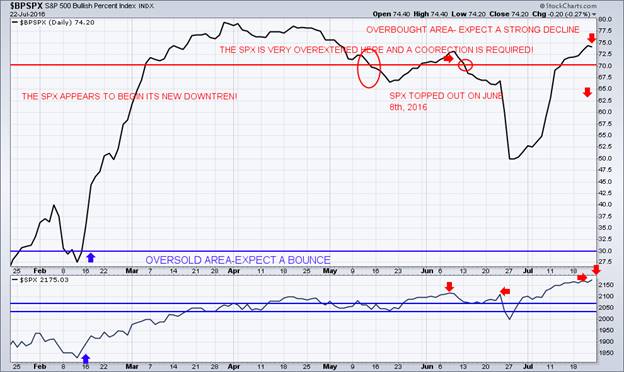
The SPX continues to develop and complete its Broadening Topping Pattern. The next trend is downwards! We are NOT currently in a trending mode…so tread lightly during these choppy times.
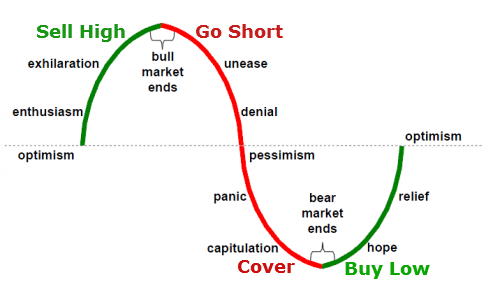
What Emotion Is Driving The Market Now?
CNN’s Fear & Greed Index tracks seven indicators of investor sentiment.
It’s displaying that the markets are way too frothy at the’ current reading of 86. It is important to note that this is a contrarian indicator, meaning when everyone is bullish and buying. Consequently, the market should be close to topping out…and falling in value.

As the markets are pushing higher, investors tend to become warier by nature. This often leads to the markets climbing the proverbial “wall of worry”. Are investors missing out on the opportunity of higher prices?
This Is Classic Negative Divergence
I believe the market is topping near these levels, because of the divergence between the Dow Industrials and the Transports. The Industrials have made a new all-time record high, but the Transports have not.
One of the many near-term indicators I am watching pertains to Dow Theory. It is one of the more visible core tenets of Dow Theory. Moreover, it’s important to see price confirmation (directionally) from both the Dow Jones Industrial Average (DJIA) and Dow Jones Transportation Average (DJT). The Industrials reached new all-time highs, while the Transports have not. The Russell 2000 (IWM) have NOT confirmed this high either, confirming there is a broad weakness in stocks. The Russell 2000 typically leads stock market rallies and selloffs.
The market trend is UP when both forge higher highs. The market trend is DOWN when both forge lower lows. A “non-confirmation” is present when only one forges a higher high, but other makes lower lows.
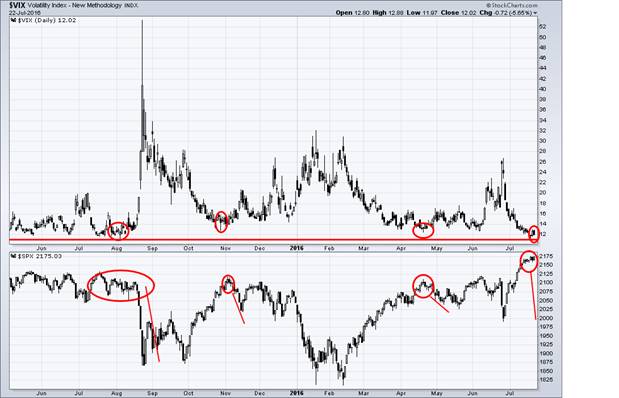
The Volatility Index VIX recently dropped to a multi-year low. It is now trading at levels where it was last August 2015, before it exploded to 40. In fact, a few days ago, there was a good article talking about the put/call options ratio and VIX and how they are both at extremes – pointing to a significant correction in the next couple weeks.
Another Chart You Need to View
Helicopter Money
During the last couple of weeks, gold prices have been in a corrective wave. However, this pattern calls for a continued uptrend to begin within the next couple of weeks.
Japan has promised to buy One Trillion Yen worth of new government debt…and perhaps even begin the “Helicopter Money” plan of direct government debt monetization going forward.
There are two events that will occur within 36 hours of each other this tomorrow, July 27th, 2016 and Friday, July 29th, 2016:
Wednesday, July 27th, 2016 – FOMC meeting ends with “Fedlines” announced at 2:00 pm EDT. Expect no rate changes!
Friday, July 29th, 2016 – The Bank of Japan meets and releases its latest QE plans. Former Federal Reserve Chairman Ben Bernanke told Prime Minister Shinzo Abe that there were still “various tools available” for monetary policy to spur growth.
A Reuters’ poll showed 85 percent of analysts expect the BOJ to ease on July 29th, 2016, alongside the fiscal spending boost Abe is set to announce this month.
In Japan, where government bond yields have fallen below zero, and faith in “Abenomics” is flagging, gold sales are soaring.
It is not unreasonable to expect the same here in the US between now and November 2016…and beyond.
Tracking Insider Activity Matters
Insider behavior matters because research based on real-time signals has shown that a properly modeled picture of insider actions can provide the most accurate reflection of the prospects for the company, industry, economic sector, or even the stock market in general, going forward.
This makes perfect sense from an intuitive perspective. Corporate insiders possess all the necessary skills and characteristics that one could use to describe the “successful” investor. A couple days ago I did talk in detail about how company executives disguise poor earnings numbers through the share buybacks we have seen the past year.
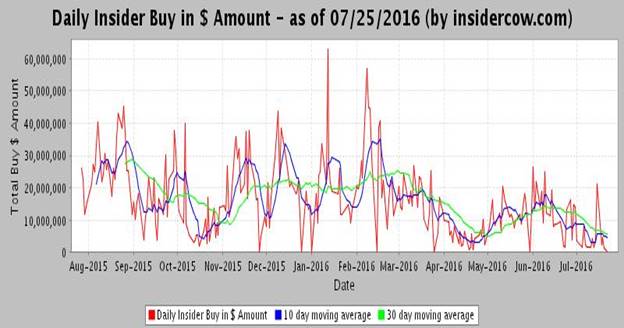
The chart and tables listed below are tough to read but the heading above each chart explains what each chart is telling us what insiders are doing with their money.
Daily Insider Buying Amount Is Down Sharply for 2016
HUGE Insider SELLING of Oil, Gas And Pipeline Companies
HUGE Insider SELLING of Internet Providers/Services/Technologies
HUGE Insider SELLING of Large Conglomerate Companies
HUGE Insider SELLING of Real Estate Based Companies/Funds
- REIT Offices
- REIT Retail
- REIT Diversified
- Hospitals
Concluding Thoughts
We believe the average market participants who are bullish on the stock market, and feeling really great about their future, will soon be left holding a huge portfolio of stocks trading 30-50% below the value they paid for them.
Wall Street insiders have been, and continue, to sell their shares as they see the music stopping sooner than later — and do not want to be the ones left holding equities when the bottom falls out.
When the equities market does roll over, money will be looking for a safe place to hide, which will be precious metals and US bonds.
Major market tops, like the one that has been forming for many months now, do take time to unfold. Moreover, they tend to take longer than one expects. Based on many different types of market and economic analysis, it’s just a matter of time now before something, or someone, triggers a selloff in stocks.
The exciting side of all this is that the stock market falls 3 to 7 times faster than it rises. And through inverse exchange traded funds and VIX ETF trading strategies one can profit from a collapsing stock market.
Get My ETF Signals And Profit – CLICK HERE
Chris Vermeulen
Join my email list FREE and get my next article which I will show you about a major opportunity in bonds and a rate spike – www.GoldAndOilGuy.com
Chris Vermeulen is Founder of the popular trading site TheGoldAndOilGuy.com. There he shares his highly successful, low-risk trading method. For 7 years Chris has been a leader in teaching others to skillfully trade in gold, oil, and silver in both bull and bear markets. Subscribers to his service depend on Chris' uniquely consistent investment opportunities that carry exceptionally low risk and high return.
Disclaimer: Nothing in this report should be construed as a solicitation to buy or sell any securities mentioned. Technical Traders Ltd., its owners and the author of this report are not registered broker-dealers or financial advisors. Before investing in any securities, you should consult with your financial advisor and a registered broker-dealer. Never make an investment based solely on what you read in an online or printed report, including this report, especially if the investment involves a small, thinly-traded company that isn’t well known. Technical Traders Ltd. and the author of this report has been paid by Cardiff Energy Corp. In addition, the author owns shares of Cardiff Energy Corp. and would also benefit from volume and price appreciation of its stock. The information provided here within should not be construed as a financial analysis but rather as an advertisement. The author’s views and opinions regarding the companies featured in reports are his own views and are based on information that he has researched independently and has received, which the author assumes to be reliable. Technical Traders Ltd. and the author of this report do not guarantee the accuracy, completeness, or usefulness of any content of this report, nor its fitness for any particular purpose. Lastly, the author does not guarantee that any of the companies mentioned in the reports will perform as expected, and any comparisons made to other companies may not be valid or come into effect.
Chris Vermeulen Archive |
© 2005-2022 http://www.MarketOracle.co.uk - The Market Oracle is a FREE Daily Financial Markets Analysis & Forecasting online publication.