Successfully Forecasting Crude Oil Price from 2014 to Today
Commodities / Crude Oil Jul 14, 2016 - 05:22 PM GMTBy: EWI
 The Wave Principle helped investors prepare for today's energy market action
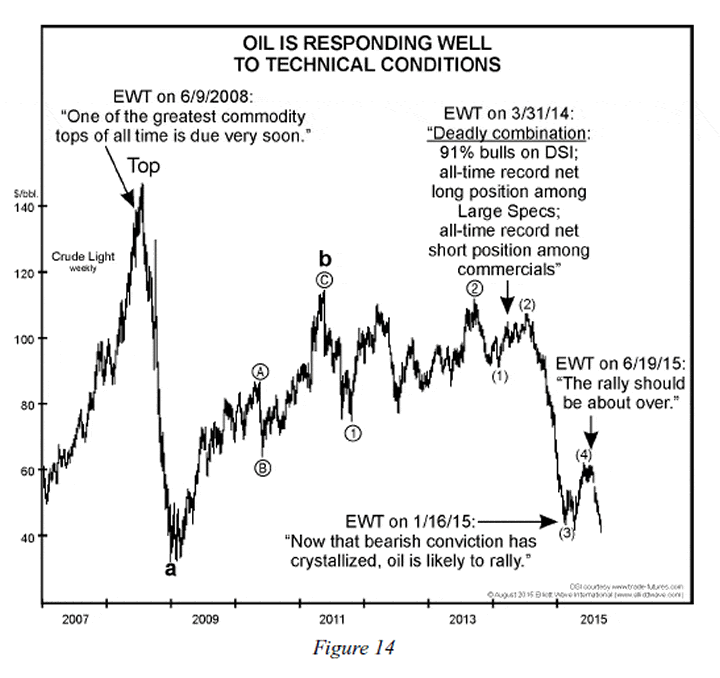
March 31, 2014 was no time to issue a bearish forecast for crude oil -- or so it appeared.
But that's exactly the scenario Elliott Wave International's founder Bob Prechter showed his subscribers in his monthly Elliott Wave Theorist.
In 2013, crude had broken above $100 per barrel. It stayed mostly above that price for several months into 2014. Conventional wisdom was bullish on crude oil.
Yet on March 31, 2014, Prechter showed his readers how the bullish sentiment was actually a strongly contrary indicator. The Daily Sentiment Index then stood at 91% bulls -- the most extreme bullish reading in the history of the indicator.
And, more importantly, Theorist charts showed subscribers why the bull run was near an end. The trend should turn soon.
"Markets cannot stand such a high level of optimism among commodity investors for long. Whatever happens to oil prices in coming weeks," said Prechter. "The outlook is for much lower prices."
Indeed -- just as Prechter said -- extreme optimism for crude oil did not stand for long.
The turn came less than three months later, in mid-June 2014. It wasn't just that crude stopped going up; it crashed.
Through January 2016, the price for a barrel of crude fell 70%.
All that said, here's what the chart below makes clear: The 2014 forecast was just one of many huge moves in crude in the past 10-plus years. See for yourself how Elliott Wave Theorist subscribers were ready.

Bob Prechter has a decades-long habit of defying expectations and forecasting major turning points. And the same approach that alerted subscribers to the turns in these markets is equally clear about the next big moves in their respective trends.
|
Unleash the power of the Wave Principle with this FREE Report Much like a great sports play; to appreciate a great market forecast, you have to see it. In fact, we'd like to show you four -- S&P 500, Gold, Oil and Apple -- in a new report. You will see what can happen when Elliott analysis meets opportunity. Now we're not asking you to attend a class in "good calls." In each of these four markets, the unfolding trends have (once again) reached critical junctures. You really, really want to see what we see, right now. |
This article was syndicated by Elliott Wave International and was originally published under the headline Case Study: Successfully Forecasting Crude Oil from 2014 to Today. EWI is the world's largest market forecasting firm. Its staff of full-time analysts led by Chartered Market Technician Robert Prechter provides 24-hour-a-day market analysis to institutional and private investors around the world.
About the Publisher, Elliott Wave International
Founded in 1979 by Robert R. Prechter Jr., Elliott Wave International (EWI) is the world's largest market forecasting firm. Its staff of full-time analysts provides 24-hour-a-day market analysis to institutional and private investors around the world.
© 2005-2022 http://www.MarketOracle.co.uk - The Market Oracle is a FREE Daily Financial Markets Analysis & Forecasting online publication.


