


A Fed Bondsy Scheme
Stock-Markets / Stock Markets 2016 Jul 12, 2016 - 02:53 PM GMTBy: Ed_Carlson

Who needs the Fed's QE when the world is seemingly beating down the doors to buy US bonds? But like all Ponzi schemes, the end eventually comes. Last week's record low in bond yields arrived at the same time as an expected 6 month low in yields and may have marked at least a temporary end to the scheme. Stay tuned for a reversal in interest rates and its effect on equity markets as liquidity in global markets dries up.
Over 30% of global sovereign bonds are trading at negative interest rates with the Dutch 10yr bond the latest to go negative last week. The yield on the 10-year Treasury note set a record low on Friday and appears headed for a negative rate in the future. Defensive sectors like utilities, telecom, and staples are wildly outperforming and trading at rich multiples, historically. VIX has dropped over 48% in the last two weeks... the biggest collapse in fear ever. Gold was up for the 6th straight week... the longest streak since its bull market topped in Aug 2011. Something is wrong!
I have allowed for the possibility that the February low was the bottom of the Basic Decline which began in May 2015 (making it a sub-normal Basic Decline) but my base case has been that the final low is still ahead of us. A long Basic Decline must end no later than August 7 and the Hybrid forecast is for a low during the final days of July. If the upcoming low is higher than earlier lows this year then a new bull market can be presumed to have begun in February. But with the observations noted above, it seems markets still have a strong possibility of breaching those lows. If correct, look for a nice bounce in August prior to the second Basic Decline usually seen in Terminal Declines of the Long Cycle.
For now we are focused on the Hybrid Lindsay forecast for a top... now. Last Friday or early this week. The forecast is laid out below.
July 8-12 High
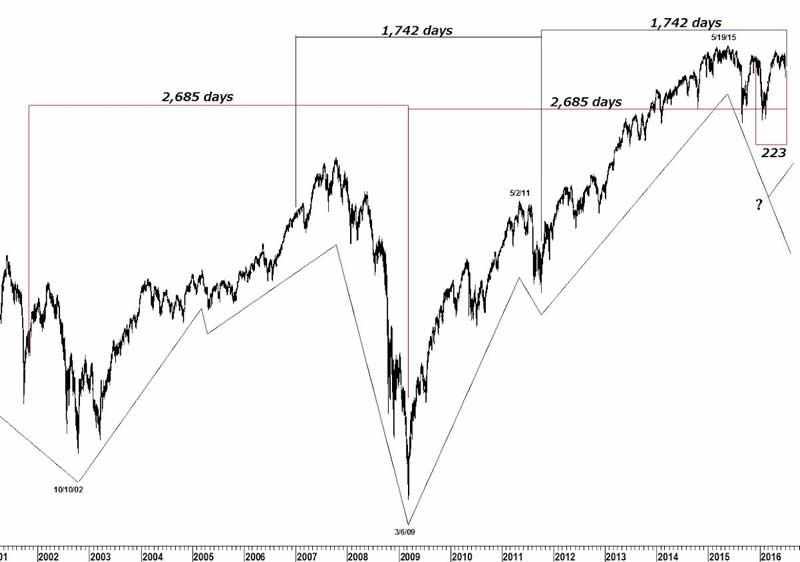
The high of a flattened top on 12/27/06 counts 1,742 days to the low of the Basic Cycle on 10/4/11. 1,742 days later is Monday, July 11. A breakdown from a flattened top on 10/29/01 counts 2,685 days to the low of the Multiple Cycle on 3/6/09. 2,685 days later is Tuesday, July 12.
Cycles
A micro-cycle points to a high near Friday, July 8. That cycle may force the high to come before the weekend, rather than after it. A weekly cycle high points to the same week.
Lindsay Intervals
A 222-day interval (221-224) from 12/1/15 points to a turn in the period July 11-12. A 107-day interval (102-112 days) counts 106 days to July 8.
Try a "sneak-peek " this month at Seattle Technical Advisors.com
Ed Carlson, author of George Lindsay and the Art of Technical Analysis, and his new book, George Lindsay's An Aid to Timing is an independent trader, consultant, and Chartered Market Technician (CMT) based in Seattle. Carlson manages the website Seattle Technical Advisors.com, where he publishes daily and weekly commentary. He spent twenty years as a stockbroker and holds an M.B.A. from Wichita State University.
© 2016 Copyright Ed Carlson - All Rights Reserved
Disclaimer: The above is a matter of opinion provided for general information purposes only and is not intended as investment advice. Information and analysis above are derived from sources and utilising methods believed to be reliable, but we cannot accept responsibility for any losses you may incur as a result of this analysis. Individuals should consult with their personal financial advisors.
© 2005-2022 http://www.MarketOracle.co.uk - The Market Oracle is a FREE Daily Financial Markets Analysis & Forecasting online publication.